Overview: Servers
For Cloud Servers
After logging into the Cloud Panel, the Infrastructure > Servers section is displayed. In the upper-right corner, the date and time of the last login to the Cloud Panel and the IP address from which the login was made are listed. If a login fails, in addition to the above information, you will also see the number of failed login attempts since the last successful login and the country where the login was attempted.
In the Infrastructure > Servers section you can manage your servers. In this section you can start, restart and shut down the server. In addition, you can reinstall the server if necessary. To perform any of these actions, activate a server and click Actions. Then you can perform the desired action.
All the servers you have configured are listed in a table. This table lists the most important information about each server:
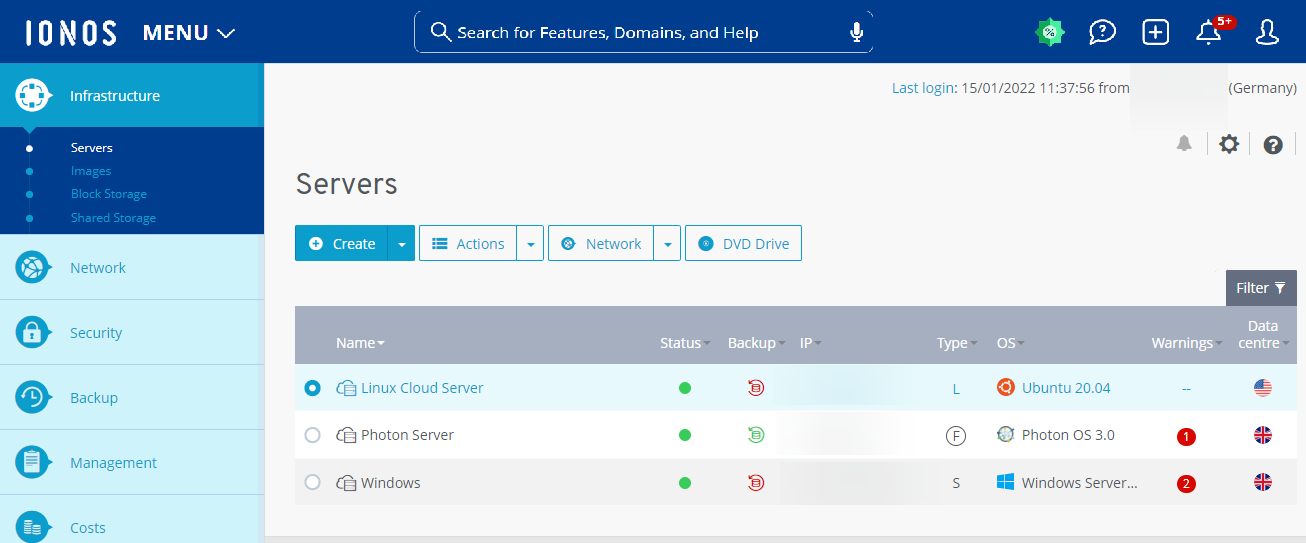
Name: Name assigned to the server. You can change the server name at any time.
Status: current status of the server. You can change the status of the server at any time by clicking the status.
On: The server is in operation.
Off: The server is switched off.
Starting: The server is being turned on.
Restarting: The server is being restarted.
Server is being created: The server is being set up. The progress is given as a percentage.
Being configured: The configuration of the server is being adjusted.
Turned off: The server is turned off.
Will be removed: The server will be deleted.
Backup: This section indicates whether a backup plan has been configured for the server and backups are being made regularly.
Green:A backup package has been set up, the Backup Agent has been installed on the server, a backup plan has been configured, and regular backups are being made.
Yellow: A backup package has been set up, the Backup Agent has been installed on the server, but no backup plan has been configured.
Red: The Backup Agent has not been installed on the server and no backup plan has been configured.
IP: IP address assigned to the server. If multiple IP addresses have been assigned to the server, an icon appears showing the number of IP addresses assigned. To view all IP addresses, hover the mouse over the icon.
Type: selected configuration
OS: Operating system of the server
Warnings: If you monitor your server with a monitoring policy, then you will receive a notification when the set thresholds are exceeded. In addition, warnings are displayed when backups complete with warnings or errors, or when the server is not protected by backups. These warnings are not displayed if Backup Agent is not installed on the server.
Data Center: IONOS Data center where the server is hosted.
To access all the information about the desired server, click on the server name. The list contains the following additional information:
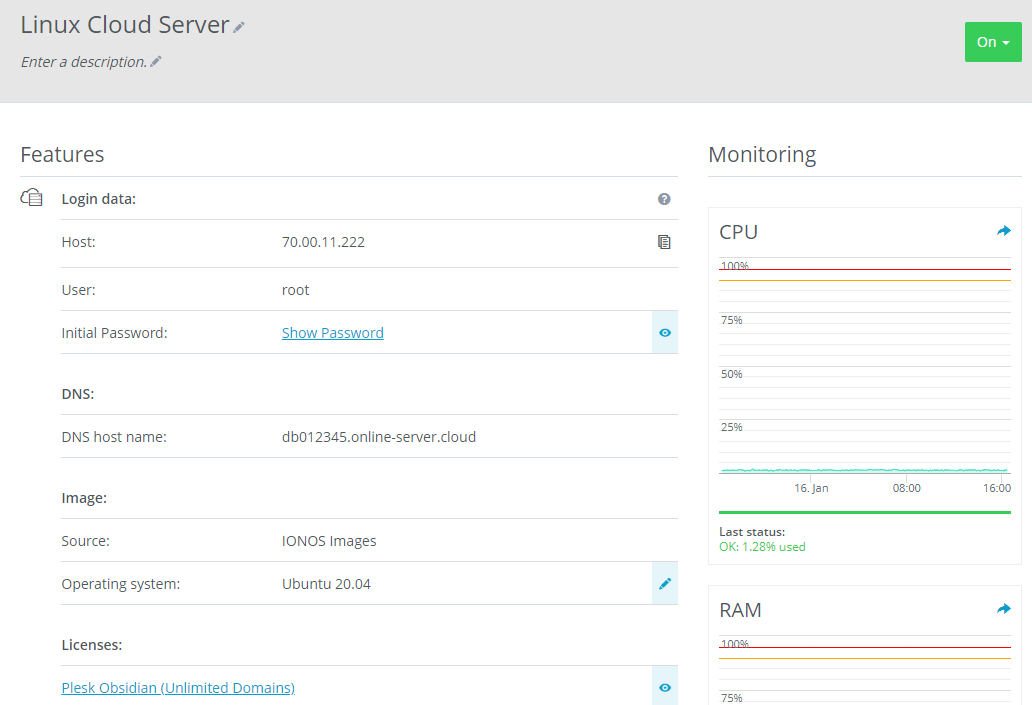
Description: Description of the server. You can change the description at any time.
Host: Displays the host.
User: User name with which you log in to the server.
Initial Password: Displays the initial password that you can use to log in to the server.
DNS Hostname: Displays the DNS hostname. The DNS hostname is a unique name for the server. It consists of a host name and a domain name.
Source: Source of the server's operating system.
Operating System: Operating system of the server.
Licenses: Displays the licenses of the additional installed applications.
Plesk: This area displays the credentials of the administrator account for Plesk. This area is visible only if you have installed Plesk.
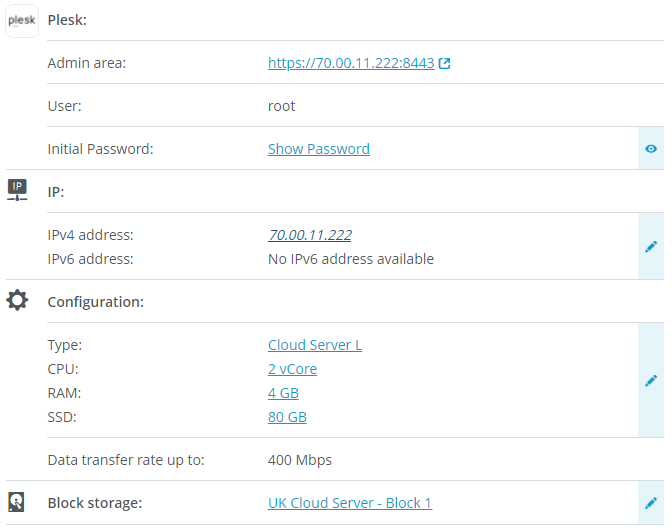
IP: Shows the IPv4 and IPv6 addresses assigned to the server.
Configuration: Configuration of the server.
Type: Selected configuration
CPU: Number of virtual main processors (vCPU) configured for the server.
RAM: memory allocated to the server.
SSD: Hard disk space allocated to the server.
Data transfer rate: Shows the maximum possible data transfer rate.
Block Storage: Displays the block storage allocated to the server.
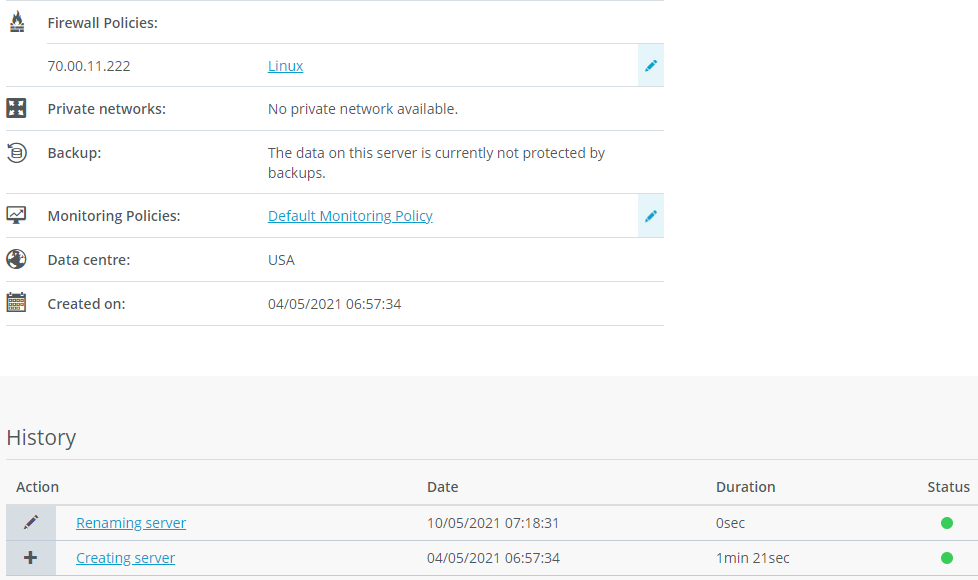
Firewall policies: Listing of the server's public IP addresses and associated firewall policies.
Note
If you do not assign a firewall policy to the server, then you can only access it using the KVM console. If you have set up a private network, access is also possible through another server.
Load Balancer: Lists the assigned load balancers.
Private Networks: Indicates whether the server is assigned to a private network.
Snapshot: Indicates whether a snapshot has been created. This area is displayed only if you have created a snapshot. A snapshot is a snapshot of your server's data. If you have created a snapshot, you can restore the captured state of your server's data at any time.
Backup: Indicates whether the server is protected by backups.
Monitoring Policies: Monitoring policy that is used to monitor the server. You can assign a different monitoring policy to the server at any time.
Datacenter: IONOS Datacenter where the server is hosted.
Availability Zone: Indicates the Availability Zone in which the server was set up. Availability Zones consist of several isolated, physical locations within a data center. They are linked together via dedicated, regional networks and are designed with redundancy. This ensures that your server is available during maintenance, for example.
Creation date: Date when server was created.
History: The History section displays all the actions you have performed in the Cloud Panel in the Infrastructure> Server section.