Monitoring server performance (Windows)
Valid for Cloud Servers, migrated Cloud Servers, VPS, Dedicated Servers, and Bare Metal Servers.
In this article, we'll explain some different types of performance problems that can occur with Windows servers. In addition, you will learn which programs you can use to monitor your server to detect performance problems and eliminate the causes.
Please Note
Regular monitoring of your server is generally recommended in order to detect performance bottlenecks and any other problems that may occur at an early stage. It can also help you to detect the failure of the server or its individual components and/or applications in advance. This also applies to certain types of cyber attacks. If you are attacked, a quick response is essential to stop the attack and minimise any damage caused.
For a list of events that Microsoft recommends you monitor, please see the following article:
Types of performance problems
The causes for performance problems can be very diverse. For this reason, it is very important that they are narrowed down as precisely as possible. The following types of performance problems can occur under certain circumstances:
Low SSD/Hard Disk Access Speed:
Can occur with dedicated servers.
Is a possible cause if the server takes a long time to start the operating system or programs and/or login.
Can also occur when the operating system or programs use the swap file or need to load or save data.
High System or CPU Load:
A consistently high CPU usage rate is an indicator that the server's processor is overloaded.
If the system or CPU load is too high, there will be delays in running applications and user activities.
If the server has too little RAM, this can cause the processor to be permanently very busy.
Persistently increased processor load can also be a sign of malware.
Low Network Interface Throughput:
Leads to a general delay in rendering and response times.
A wide variety of problems can occur if the network interfaces are too busy.
Performance issues range from high latency to error messages when accessing web pages.
Analysis tips
To determine the cause of performance problems, it is important to distinguish whether they are temporary or permanent.
If the performance problems are temporary, see if you can identify a pattern. To do this, evaluate the executed processes and regularly performed tasks that are executed by your server.
If necessary, reschedule regularly executed tasks and then check whether the performance problems still occur after this change.
If necessary, check whether the performance problems always occur when a particular action is executed. For example, this could be a very slow page load or a very slow upload or download.
Research what updates have been installed on the server and find out if there is a new update that needs to be installed that will affect the performance of your server.
If a process is unknown to you or you are not sure whether it is malware, we recommend that you research the process name on the Internet. Pay particular attention to processes that require an unusually large number of resources.
Please Note
We recommend that you install security patches and updates for your operating system and installed programs regularly and in a timely manner while also making sure to test them beforehand for any possible unintended effects on your specific environment. Also, make sure that security patches and updates for the plugins you use are installed regularly.
Programs for evaluating and monitoring performance problems
You can monitor the performance of your server by using the following programs in Microsoft Windows Server 2012, 2016, 2019 and 2022:
Using the Task Manager for an initial analysis of the current system load
By default, the Task Manager displays current information about the running programs and processes as well as the system load. You can use this to get an overview of the current performance of your server.
To open the Task Manager, simply follow these steps:
Right-click the taskbar.
Click Task Manager.
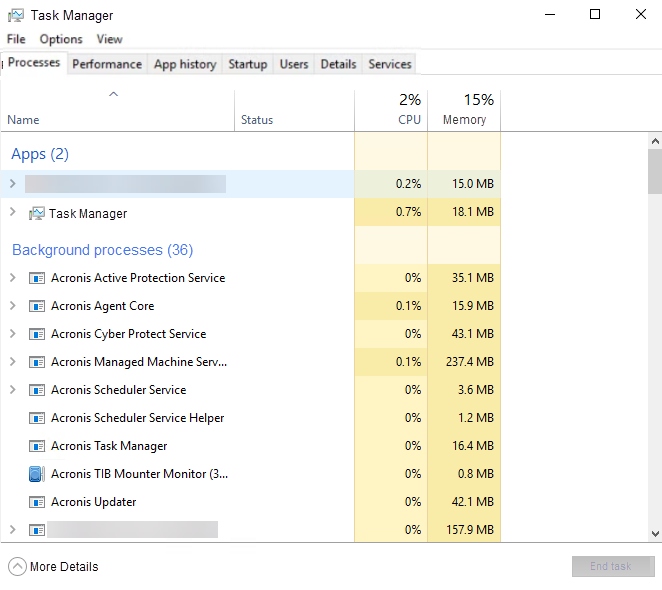
The Task Manager lists the following information:
Processes tab: The Processes tab lists the programs and processes that are currently running. In this area, you can terminate running programs and processes.
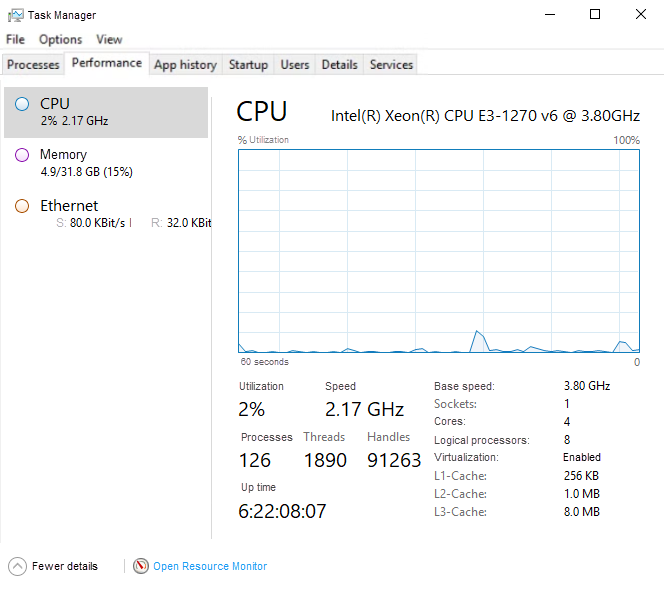
Performance tab: The Performance tab displays information about the current CPU load, the currently used memory, and the current network load. These are displayed in graphical form.
Users tab: The User tab lists the logged-in users and the programs and processes that are currently running in this user profile.
Details tab: The Details tab displays all active processes and the resources used in each case.
Services tab: The Services tab displays information about the currently running system services.
Using the Resource Monitor to monitor performance
The Resource Monitor gives you a detailed view of the current utilization of the server's CPU, disk, and memory resources, as well as network activity. These are displayed in real time. In addition, the Resource Monitor contains four animated graphs that show the utilization of the resources.
To open the Resource Monitor, do the following:
Right-click the Start icon in the taskbar.
Click on Run.
Then, in the Run window, type resmon and click OK.
The Resource Monitor lists the following tabs:
Overview: The Overview tab lists a summary of the most important resource utilization information.

CPU: The CPU section displays the processor load in detail.
Volumes: The Volumes section shows which processes perform read and write accesses to volumes and how much data a process writes and reads.
Network: The Network section shows which processes send and receive data.
Memory: The Memory section lists all processes and their memory consumption.
Please Note
To end individual processes, right-click the process you want to end. Then, click End Process.
Using Windows Performance Monitoring for further analysis
With Windows Performance Monitoring, you can collect detailed performance information on resource usage and running processes. To configure and schedule performance indicators, users can create data collector sets.
To open Windows Performance Monitoring, do the following:
Right-click the Start icon in the taskbar.
Click Run.
Then, in the Run window, type perfmon.msc and click OK.
For more information about Windows performance monitoring, click here:
Reliability Monitor
The Reliability Monitor allows you to view the stability index within a specified time period to evaluate the overall stability of the system. If you select a specific time period, you can also check for any hardware and software problems that have affected or are affecting the system.
To open the Reliability Monitor, complete the following:
Right-click the Start icon in the taskbar.
Click Run.
Then, in the Run window, type perfmon /rel and click OK.
Checking warnings and errors with the Event Viewer
Microsoft Windows Event Viewer displays information, warnings, and errors related to the hardware or operating system. If an application fails to start, for example, it is listed in the Event Log.
To open Event Viewer, do the following:
Right-click the Start icon in the taskbar.
Click Run.
Then, in the Run window, type eventvwr and click OK.