Overview: Monitoring Center
The following article explains why general monitoring is recommended and how you can recognize performance problems. Furthermore, we'll show you how the Monitoring Center in the Cloud Panel is structured and what information you can obtain regarding the availability of your server through it.
General Information on Monitoring
Regular monitoring of your servers is generally recommended in order to detect performance bottlenecks and possible problems at an early stage and to quickly notice a server failure or the failure of individual components or applications. This also applies to certain types of cyber attacks. If you are attacked, a fast response is essential to stop the attack and minimize the damage caused.
Extensive information on analyzing performance bottlenecks can be found in the articles below:
Opening the Monitoring Center
In order to open the Monitoring Center, go to the Cloud Panel, and in the left side menu, select Security > Monitoring Center.
Structure of the Monitoring Center
The Monitoring Center is divided into the following sections:
Overview
Resources
Charts
Reports
Warnings
Overview
Under Overview, all servers you have configured and to which you have assigned a monitoring policy are listed in a table. This table lists the following information:
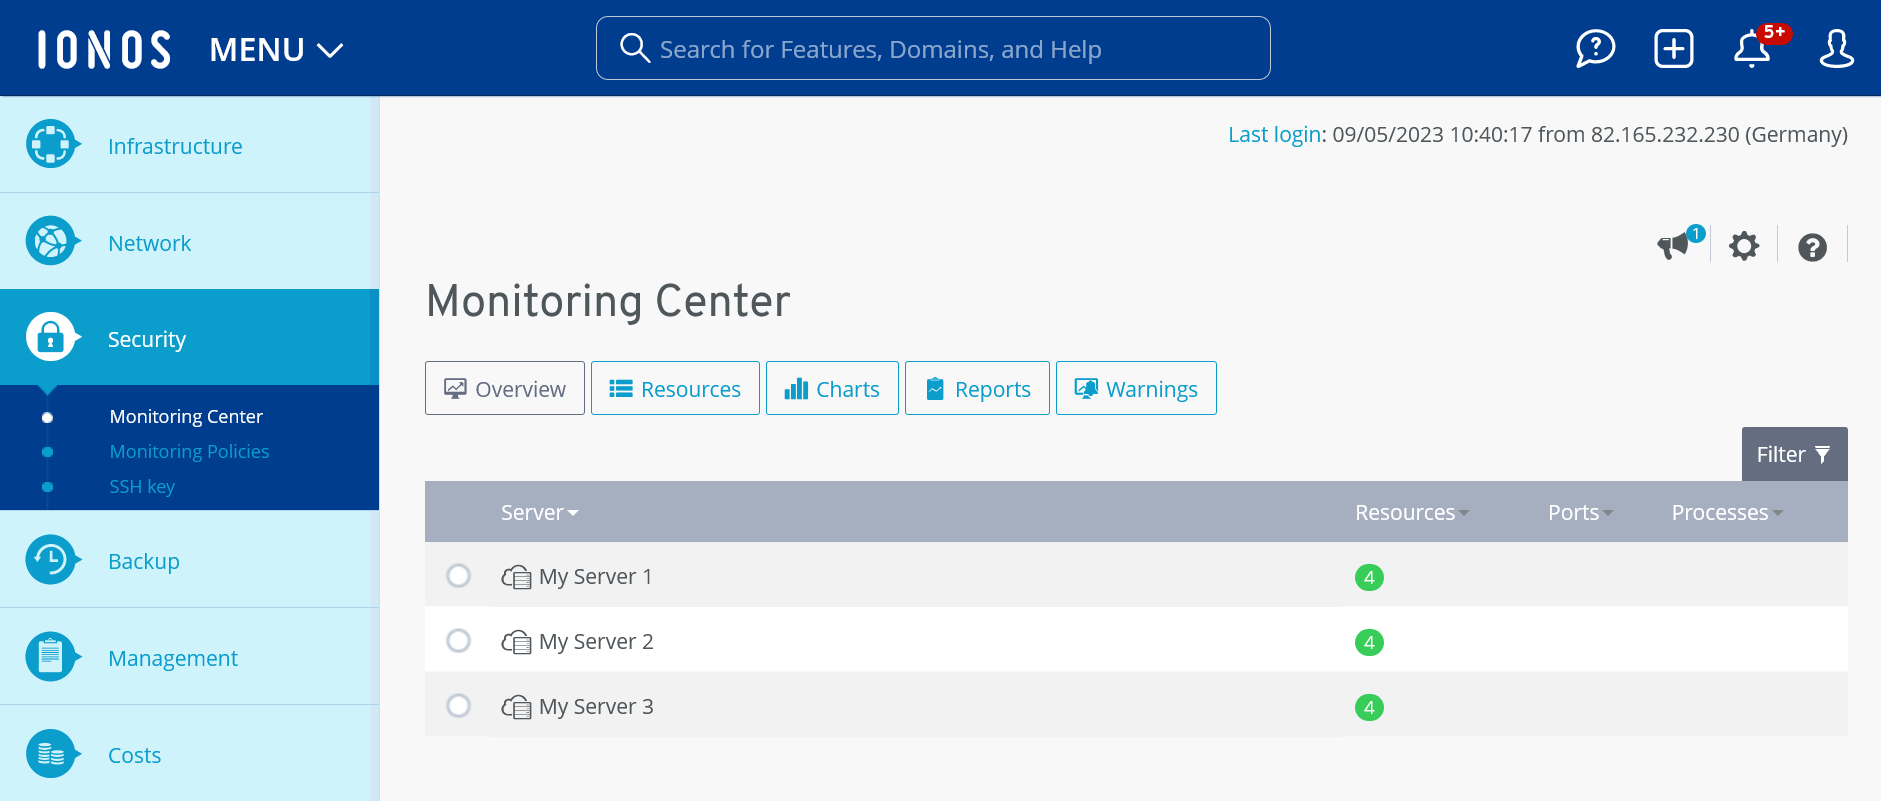
Server: Server that is monitored by a monitoring policy.
Resources: Number of monitored resources. The following resources are monitored by the monitoring policies:
CPU
RAM
SSD
Network
Ping
Ports: Number of monitored ports.
Processes: Number of monitored processes.
The color of the icons indicates the status of each notification:
Red: A problem or critical state has been reported.
Yellow: Warnings have been issued.
Green: Normal operation. Everything is okay.
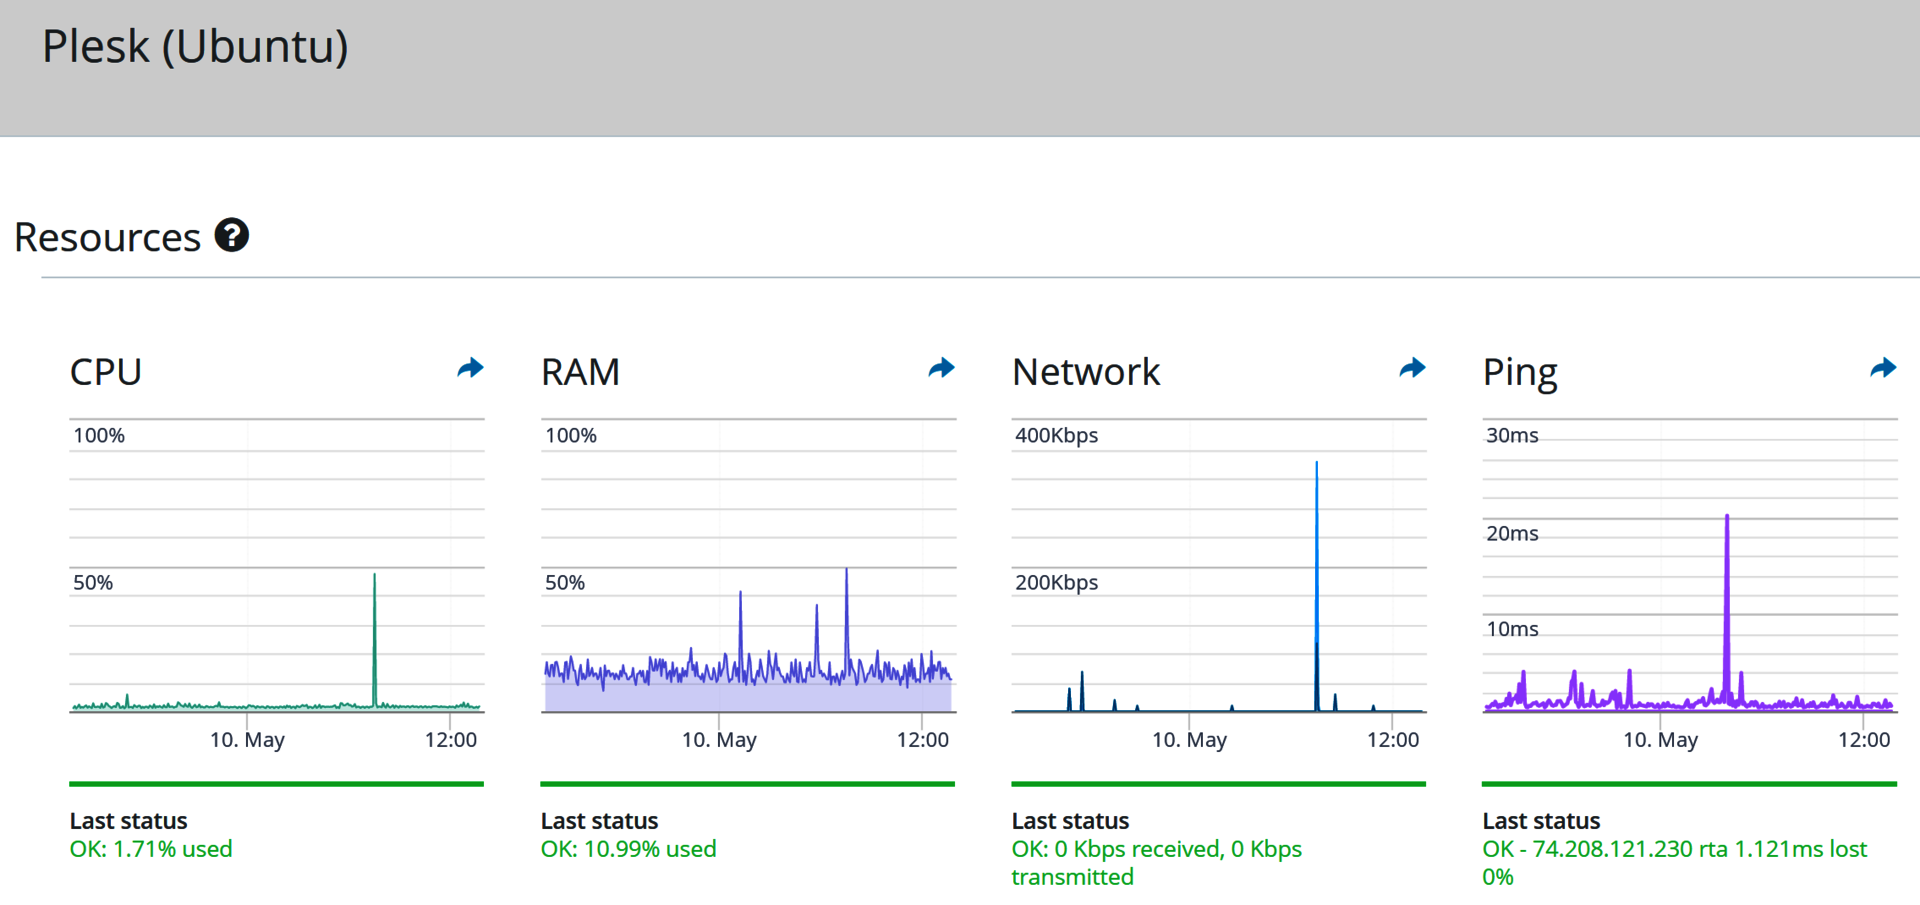
To view a graphical analysis of the monitoring of the last 24 hours as well as an overview of the status of the monitored ports and processes, click the appropriate server name.
Please Note
To retrieve information on the available storage on the SSD/HDD and on running processes, you must install the Monitoring Agent on the servers to be monitored.
Instructions for installing the Monitoring Agent for Microsoft Windows and Linux can be found in the following articles:
Installing the Monitoring Agent on a Cloud Server or a Virtual Server Cloud (Linux)
Installing the Monitoring Agent on a Cloud Server or a Virtual Server Cloud (Windows)
Installing the Monitoring Agent on a Dedicated Server (Linux)
Installing the Monitoring Agent on a Dedicated Server (Windows)
Resources
Under the menu item Resources, all monitored resources are listed in a table. The following information is listed in this table:
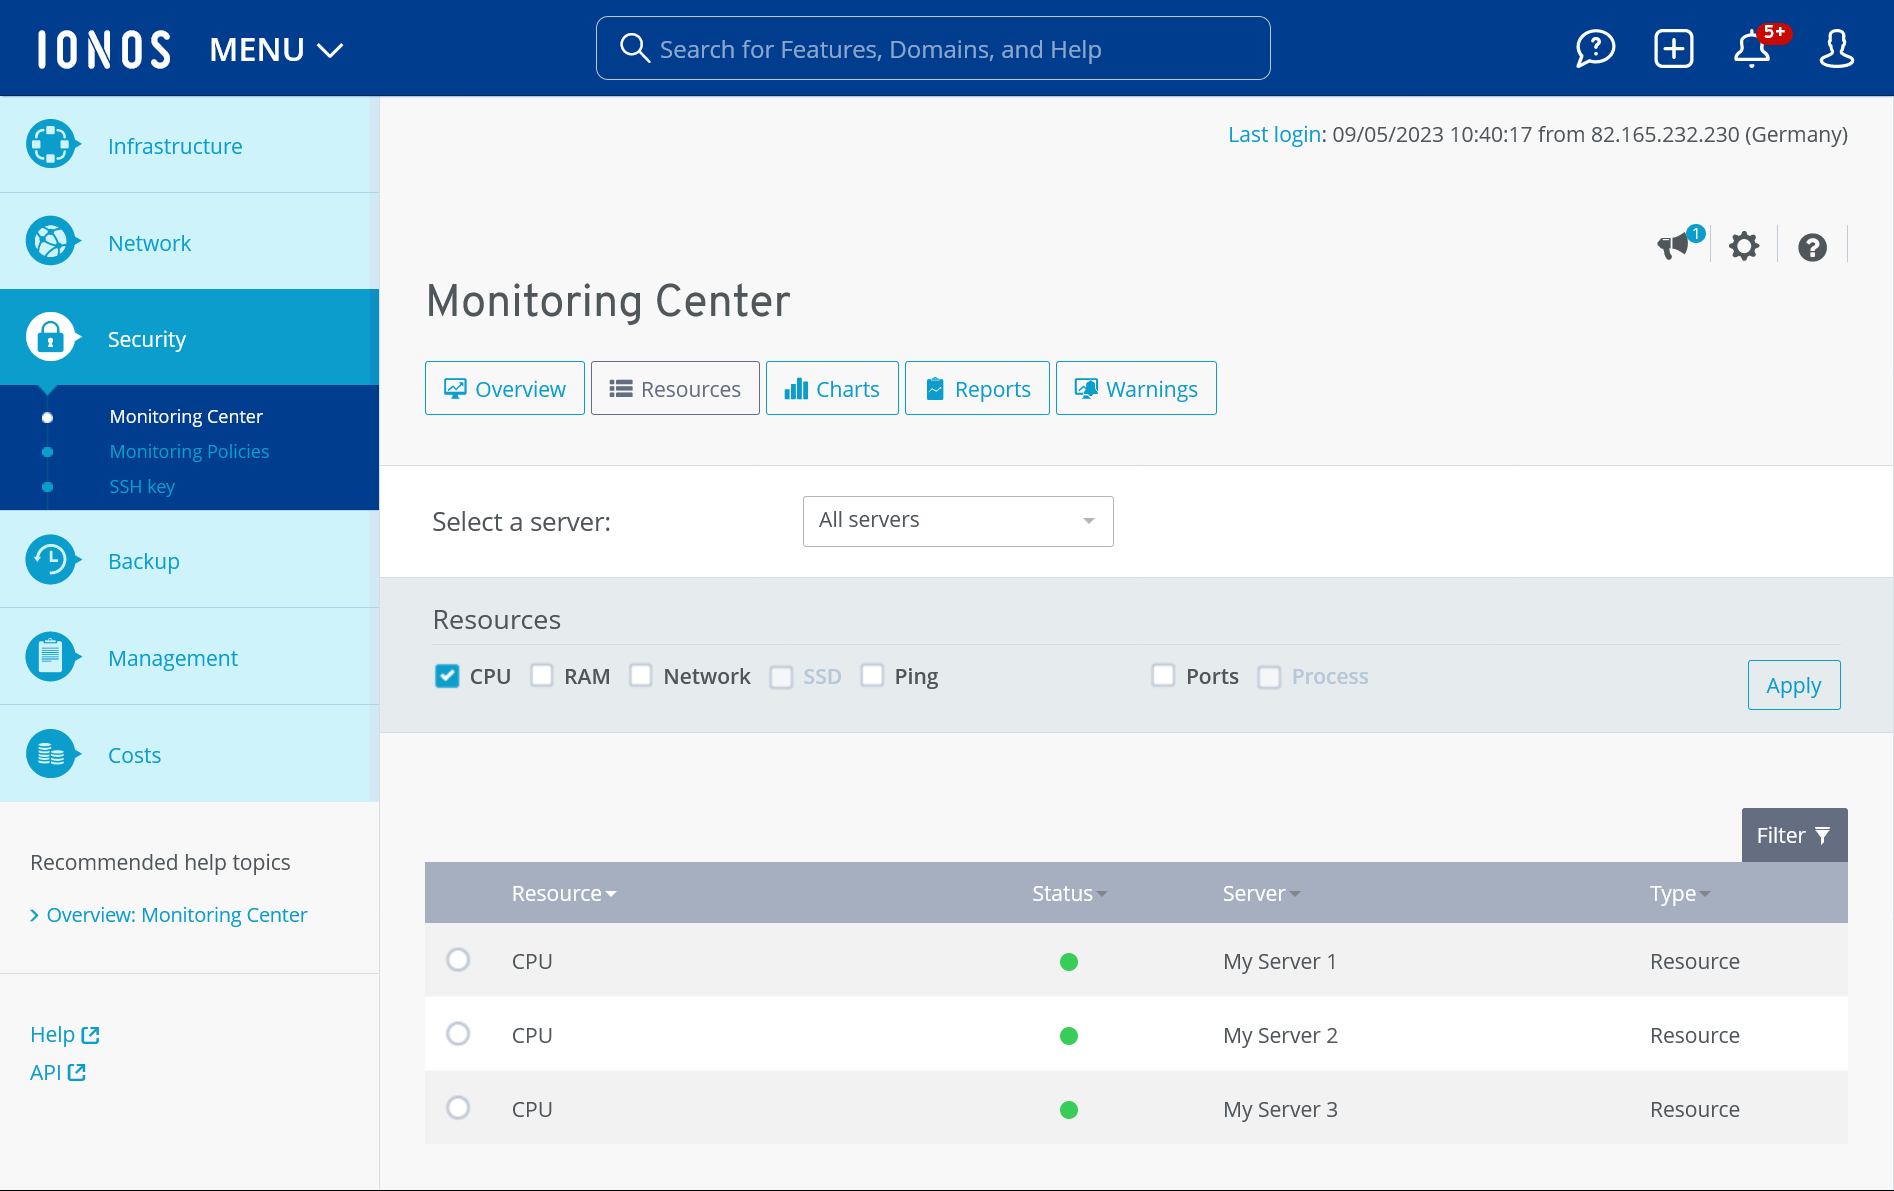
Resource: Monitored resource
Status: Status of the monitored resource
Server: Server on which the resource is monitored
Type: Type of the monitored resource
To display a user-defined graphical evaluation of individual resources, select the desired resource. Afterwards, the following information is displayed in addition to the graphical evaluation:
Last check: Date and time of the last check
Last status change: Date and time of the last status change
Duration of the last status: Duration of the last status in days, hours, minutes and seconds
Charts
In the Charts section, you can display a user-defined chart of the entire monitored resources. Alternatively, you can display a user-defined chart of the resources that are monitored on individual servers. Additionally, you can select an individual time period.
To export custom graphic evaluations as PNG or SVG files, click on the downward pointing arrow and then select the desired format.

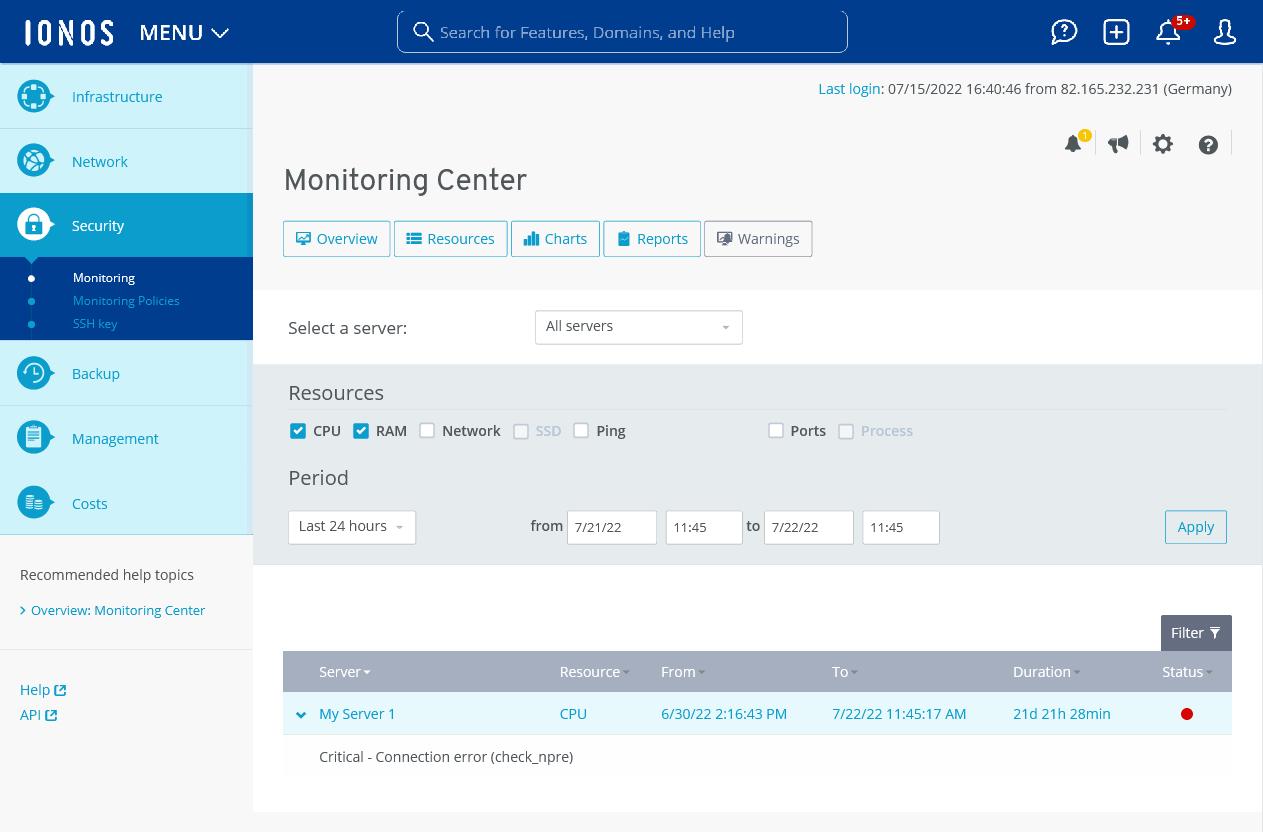
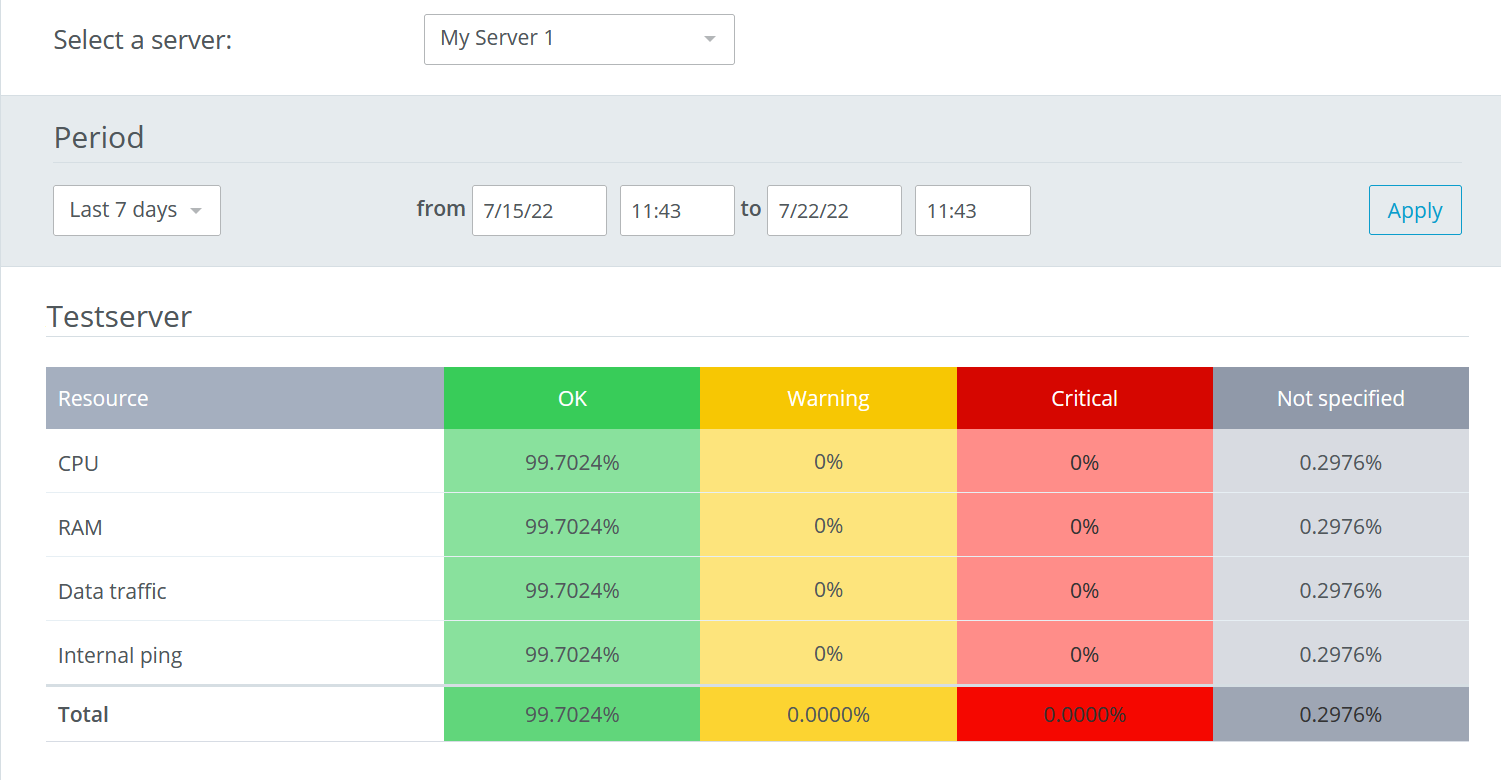
Reports
Under the menu item Reports, you can display the length of time your resources have been in a certain, defined status for each monitored resource. You can either display an evaluation for all servers or for a specific server. Additionally, you can individually define the time period displayed.
Warnings
Under the menu item Warnings, warnings that were issued for the monitored servers are displayed. You can either view all warnings or filter them by the server of your choice. Additionally, you can select individual resources to further narrow down the results.