

Financial analysis template: Using Excel to edit a financial analysis form

Many entrepreneurs have their tax consultants prepare their financial analysis, for them. However, those who have a small company usually try to do as much as possible themselves in order to save on expenses. A financial analysis template as an Excel file can help you create a financial analysis yourself every month. We offer you a financial analysis template for Excel and explain how you can fill it out and adapt it for your company.
What do you need a financial analysis for?
Financial analysis is a tool for keeping track of the economic situation of a company throughout the year. For this reason, the report is usually created on a monthly basis and contains information that also appears in the profit and loss account. The turnover is compared with the costs and thus a preliminary result is reached in several intermediate steps. In addition, there are often comparative values, for example from previous months or the previous year, which can be used to describe a development. In addition, many managing directors also add quotas to the financial analysis. This allows the percentage composition of profit or loss to be displayed.
The financial analysis is not a report required by law, unlike the balance sheets. You need to be drawing up. Therefore, there are no specific requirements for a financial analysis. However, since investors and credit institutions also often want the evaluation, you should pay attention to the clarity and comprehensibility of the financial analysis.
You would like to learn more about what financial analysis actually are? In our simple article on financial analysis we’ll explain what the report is needed for and how it is structured. In this article we go over how to structure one.
Financial analysis template: What belongs in the financial analysis?
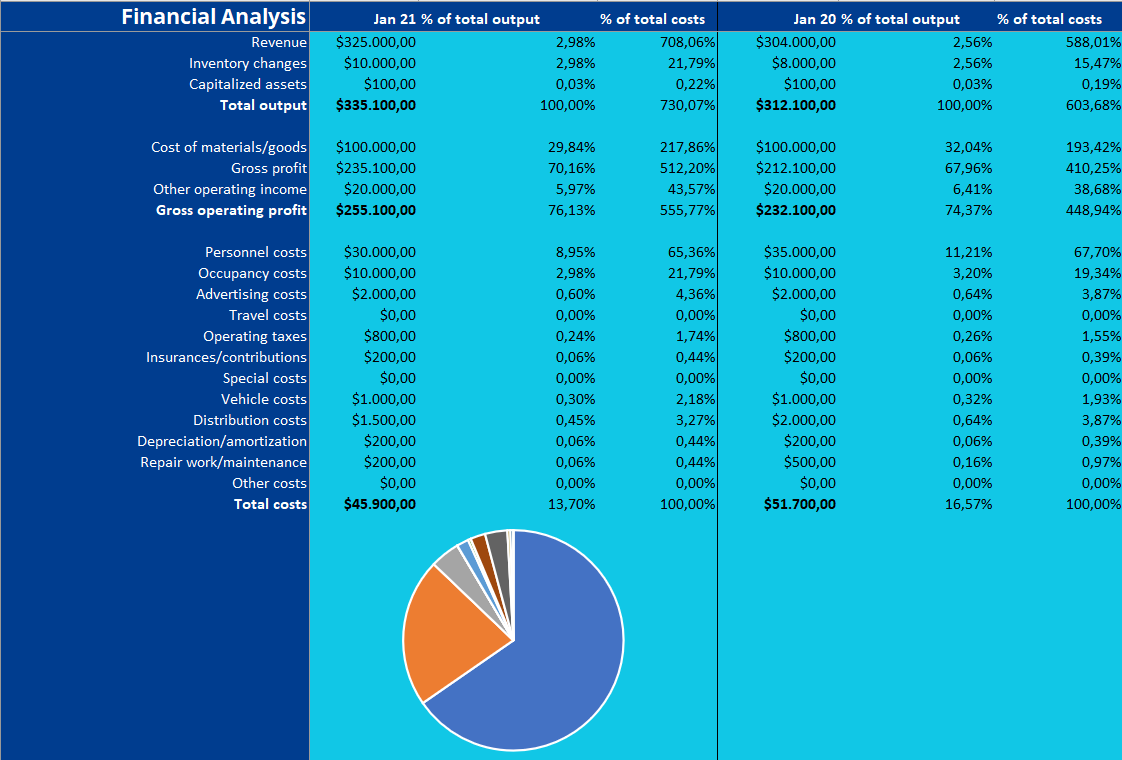
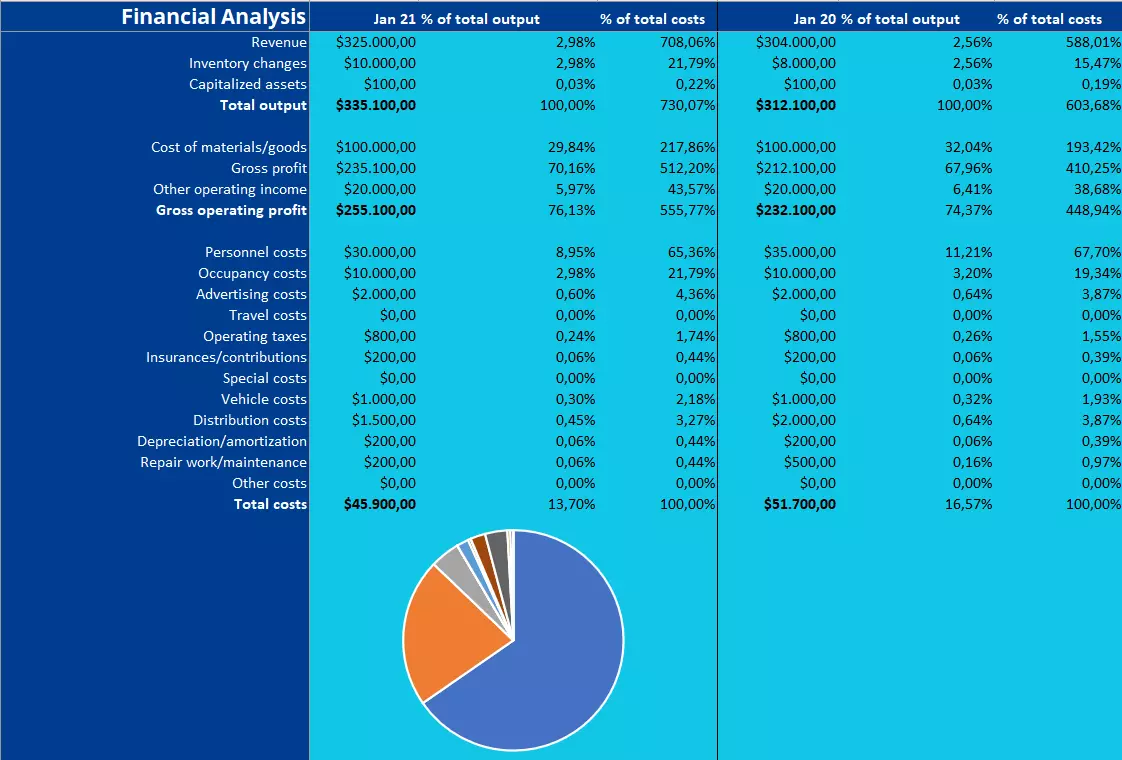
There is no fixed format for a financial analysis. In principle, you can set up the evaluation as you see fit. However, in order for the report to be as meaningful as possible, it should contain certain key figures. The structure should also make sense. When creating the financial analysis, it is a good idea to use the structure of a profit and loss account as a guideline. First, list the positive items, the sales revenues, clean them up in the next step to eliminate the inventory changes and the material usage, and then add the other revenues. This determines the gross profit.
All costs are listed below this, and then totaled. If you subtract this amount from the gross operating profit, you receive the final operating result: the result before deduction of interest and taxes. These two items are now taken into account in the next step and you receive the preliminary result – this month’s profit.
This will give you a good overview of the economic situation of your company. However, in order for you to be able to gain further information, it is worth making additional entries: it is interesting to see how the values develop. Have costs and sales increased or decreased compared to the previous month? To do this, add values from previous months or years to the financial analysis. In addition, ratios provide information on how profits or costs are made up, e.g. what proportion of the total performance you had to spend on personnel costs. If you also visualize the previous year’s figures and quotas using diagrams, you can obtain the most important information at a glance.
In our financial analysis template, which is available to download, all the essentials are already included. Enter your values and the stored functions will calculate the results automatically.
Customizing a financial analysis template in Excel
Our Excel template contains several functions that simplify the work on the financial analysis. Totals, subtractions, divisions, and diagrams are filled in automatically. However, this also means that you must ensure that you do not accidentally delete or change the functions when adjusting the template. Therefore, you should know which automatisms we have included in the Excel file.
- Totals: Intermediate results are calculated using the totals formula. Values in a selected range above the result cell are added.
- Subtractions: In the financial analysis, specific subtotals are subtracted from other results. This is done in the Excel template by simply subtracting two cells.
- Divisions: A simple division is used to calculate the quotients. The corresponding cell is divided by another specific source (for example, the content of the total power). In addition, the cell must be formatted as a percentage.
- Diagrams: The given diagrams also refer to the information in the cells. If these are changed, the diagrams also adapt.
You can easily enter the costs and revenues yourself. But what if you have to enter additional items or what if certain information is not relevant for you?
Insert and remove rows
If you want to add additional items, you must insert complete rows. This is done by right-clicking on the row numbering and then on “insert cell.” An empty cell will then be inserted above the row you selected. Remember that this also adjusts the cell specifications in the formulas. Since the functions refer to specific cells, they must change accordingly. Therefore, check whether all results are still displayed correctly. If the financial analysis template contains items that you do not need, remove them by deleting the entire row. This also changes both absolute and relative references.
It is not easy to remove results that are important for further calculations. If you want to adjust your financial analysis so that the subtotals “operating result” and “profit before tax” are not included, you must also adjust the formula behind the preliminary result. This cell extracts your data from the two fields mentioned. If you delete these two, the #REF error will pop up.
Hide rows and columns
You don’t necessarily have to remove rows – or even columns – completely. If you want to keep your financial analysis slim, you can simply hide the corresponding areas. To do this, select the column or row (again right-click on the row numbering at the edge) and select “hide.” The area is no longer visible, but the corresponding values and functions still exist. Excel leaves a small column in the border area, where the hidden area is located. If you click the right mouse button again at this point, you can show the area again.
Add columns
Let’s say you want to add more months to your financial analysis. So that you do not have to re-enter all functions and formatting, you can transfer this information. To do this, select all the columns that affect the month on the far right, left click the red square in the lower right corner, and fill in the next columns. Excel has now transferred everything to the new area and adapted the cell references as well.
If you use this function to fill empty cells, you must be careful not to transfer absolute references. These will remain after filling and would have to be adjusted afterwards.
Alternatively, you can select, copy, and paste the filled area into the empty cells. The result is the same. Now, of course, the wrong values are still in the cells. As usual, you exchange them and the Excel table takes over the calculation again.
Adjust diagrams
Two graphs in particular are of interest in the context of a financial analysis: a line diagram showing the development over time and a pie chart comparing revenues and costs. You can customize both diagrams according to your needs. In addition to purely cosmetic changes, you should be particularly interested in which data is displayed. You can determine this using the diagram filter. If you click on the chart in Excel, three symbols appear: The funnel-shaped icon represents the diagram filter. By activating and deactivating the check boxes you can add or remove further data.
If, for example, you want to display each cost item individually instead of the total value, activate these boxes and uncheck the box for total costs. In this way, you can display your evaluation in the way that makes most sense for your company.
Click here for important legal disclaimers.
Reviewer

Anne-Laure Wolber
Anne-Laure has been part of the IONOS Digital Guide since its inception in 2016. As an expert in the startup category, she focuses primarily on the strategic integration of SEO, GEO, and conversion rate optimization. Over the years, she has also gained extensive experience in related performance disciplines such as lead generation and native advertising. As a polyglot, she leverages her multilingual background to develop content strategies with precision and impact for international audiences.