

BCG matrix: bringing your company forwards

How should your company progress? If you are looking for the right strategy for your products or services, the BCG matrix can help. This portfolio matrix helps with analyzing business units e.g. manufactured products. What are the chances of this product being successful? And above all: is your portfolio set up well enough to achieve long-term success for your company? The BCG matrix tells you what you need to know.
The system was developed for the Boston Consulting Group, which is why the matrix is also known as the “BCG portfolio” or simply the “Boston matrix.” The founder of the group, Bruce Henderson, had already invented the system with four sectors in 1970. His goal was to provide companies with a simple tool with which they could plan their long-term strategy: Which product lines should be invested in and which shouldn’t?
What is the BCG matrix?
Similar to the Ansoff matrix, the portfolio matrix consists of four areas, which in turn result from the combination of four different factors. The matrix itself is in a coordinate system: the x-axis indicates the relative market share and the y-axis the market growth. Both scales range from “low” to “high.” A new zone starts on half the scale. The products in the company’s own portfolio can be placed in these zones depending on the two axes.
- Market share: the relative market share results from the company’s own market share compared to that of its strongest competitor. If the value is greater than 1, you are the market leader, otherwise you’re the market follower.
- Market growth: Describes the growth of the market for a particular product unit i.e. the current market volume in comparison to that of the previous period; it is stated as a percentage.
The Boston matrix is also called “Growth share matrix” because of its axis designation.
A third dimension results from the sales of the corresponding product. This is expressed by the size of the circle representing the respective business unit.

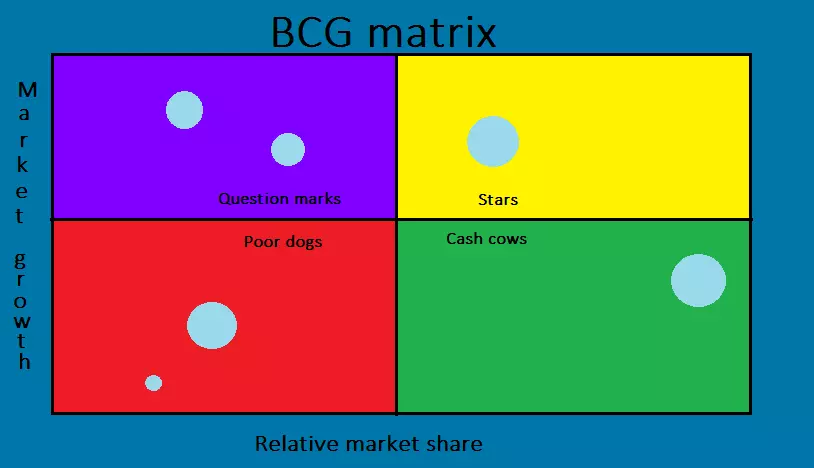
Depending on which zone the product is located in, different strategies can be established for your further planning.
Question marks
Products in the “question mark” category are characterized by high market growth combined with a low market share. These are generally new products and services that still have a small market share compared to that of the competition, but are in a rapidly growing market. These products are called question marks because it’s impossible to estimate any future development. In order for the products to be successful in the long term – i.e. to move into the “stars” category – entrepreneurs have to invest a great deal.
The problem is that it requires a lot of investment to make a question mark product more successful because the item can’t support itself. The strategy is therefore very clear: selection. A company cannot afford to fund every business unit in this area and must choose exactly which product it wants to invest money in.
Stars
Stars have both a high market share and high market growth. As market leaders, these “stars” have a high return on investment (ROI). Therefore, it’s not a problem to continue investing in these products and therefore ensure long-term success. If stars maintain their high market share over a longer time, they can become cash cows.
Cash cows
Products or services known as “(dairy) cows“ also have a relatively high market share, but are in a market that is growing very slowly or not at all. They generate a very high and steady cash flow even without any investments. On the contrary: Products found in the cash cow area of the portfolio matrix generate the financial means that are invested in question marks or stars.
Poor dogs
“Poor dogs” are products or services that a company is phasing out. Market growth is low, stable, or even declining. The relative market share is also low: compared to the market leaders, hardly any sales are generated with these products. As a result, products like these are barely self-sustaining. Companies must pursue a divestment strategy when the product can sustain itself no longer. The capital contained in these products is extracted again in order to have more liquid funds.
Thanks to its wide range of programs, Microsoft 365 is guaranteed to lighten your workload. Get the package that best suits your needs now from IONOS!
The BCG matrix explained using an example
We’ll use a fictional company: Bob’s Butchers. With the help of the Boston Consulting Group matrix, the managing director of the company wants to review the portfolio and develop sustainable strategies. The company currently has six products on the market: beef goulash, pheasant, chicken, pepperoni, chorizo, and a vegetarian sausage. Bob’s Butchers has two competitors: Brenda’s Butchers and Barry’s Butchers. The BCG matrix first of all needs an analysis of the market and the competition in order to calculate the market growth and relative market share figures. The managing director receives the following (fictitious) values:
Market growth
To determine market growth, the managing director looks at the entire market and compares the two previous years with each other.
| 2016 (in millions. $) | 2017 (in millions. $) | Market growth | |
| Beef goulash | 12 | 13.8 | 15 % |
| Pheasant | 15 | 15.75 | 5 % |
| Chicken | 2 | 2.04 | 2 % |
| Pepperoni | 7.3 | 7.8 | 7 % |
| Chorizo | 2 | 2.36 | 18 % |
| Vegetarian sausage | 5.2 | 6 | 15 % |
Relative market share
For the relative market share, the market shares of your own company and those of all competitors must be taken into account. The value results from how your own company relates to the market share of the most successful competitor in the respective business unit.
| Bob’s Butchers | Brenda’s Butchers | Barry’s Butchers | Rel. market share | |
| Beef goulash | 55 % | 40 % | 5 % | 1,37 |
| Pheasant | 27 % | 54 % | 19 % | 0,5 |
| Chicken | 16 % | 36 % | 48 % | 0,33 |
| Pepperoni | 60 % | 32 % | 8 % | 1,87 |
| Chorizo | 20 % | 52 % | 28 % | 0,38 |
| Vegetarian sausage | 34 % | 18 % | 48 % | 0,7 |
Now Bob’s Butchers’ managing director can enter their products in the BCG matrix from the calculated data. In doing so, it also takes into account the sales generated by each business unit and incorporates this information into the size of the circles.
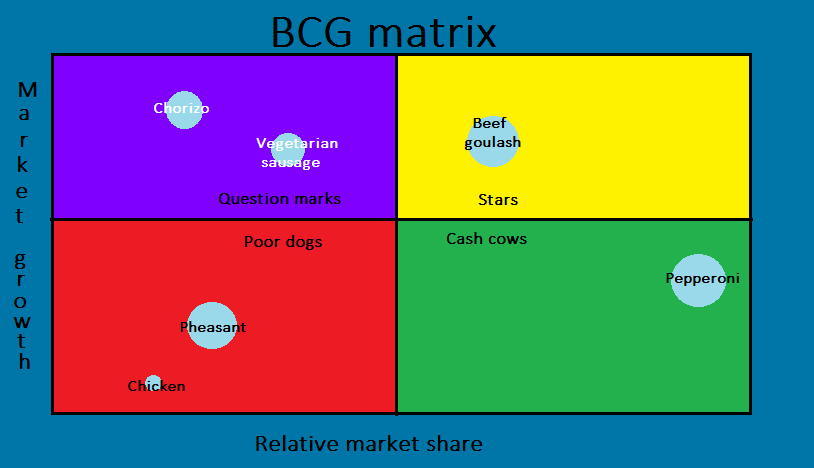
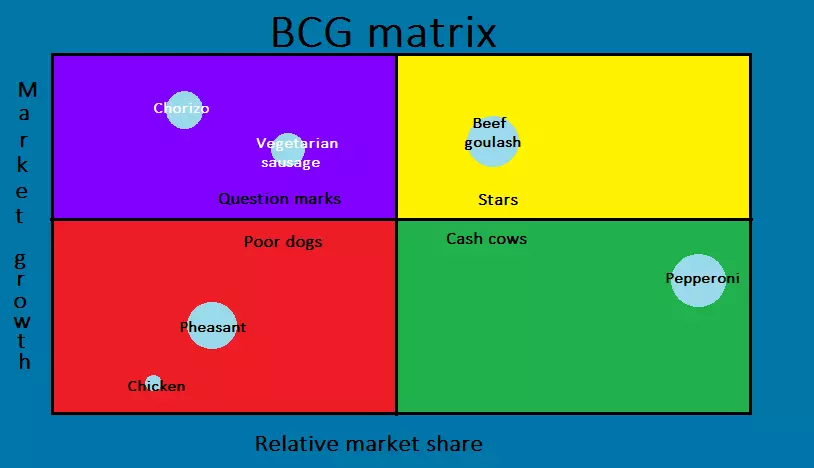
Now Bob’s Butchers’ managing director can see how to plan investments in their products. The pepperonis have turned out to be cash cows; they generate enough cash flow to finance the beef goulash so this is a star that the managing director should definitely invest in. However, the question is how should the manager deal with the two questions mark products: chorizo and vegetarian sausage? However,
It may be advisable to make a selection: The managing director could, for example, decide to only promote vegetarian sausages if they think this could be the most promising. If the vegetarian sausage develops into a star, Bob’s Butchers must not forget to create a new question mark to be successful in the long run. The company also has two poor dogs: pheasant and chicken. While the pheasant still generates quite high sales, the chicken is very poorly positioned. This tells the managing director one thing: disinvestment.
The BCG matrix enables a company to sustainably plan the future of business units and investments.
Reviewers

Anne-Laure Wolber
Anne-Laure has been part of the IONOS Digital Guide since its inception in 2016. As an expert in the startup category, she focuses primarily on the strategic integration of SEO, GEO, and conversion rate optimization. Over the years, she has also gained extensive experience in related performance disciplines such as lead generation and native advertising. As a polyglot, she leverages her multilingual background to develop content strategies with precision and impact for international audiences.

Christian Heldmaier
Christian Heldmaier is an experienced online marketing and SEO specialist from Karlsruhe. He has been working as an SEO Manager at IONOS since July 2020.