

ABC analysis: a method for business planning

It is important for management to know which products, customers or purchased parts contribute most to the company's success. ABC analysis provides a solid assessment for this purpose and illustrates how important individual items are for the company. For example, this method enables you to determine which customers contribute the most to your total revenue or which purchased parts incur the highest production costs. This information can then serve as a basis for further business planning.
What is ABC analysis? Definition and background
ABC analysis is a business management method used to visualize the situation in a company. It is used to answer revenue-related questions and then to develop targeted actions for the future based on these answers. The following are typical questions which ABC analysis is designed to answer:
- Which customers contribute the most to your total revenue?
- Which resources incur the highest storage and procurement costs?
- Which products or services generate the highest profit?
To answer these questions, the items being analyzed are divided into three categories: A (very important), B (moderately important) and C (less important). This analysis is based on what percentage share of the total an individual item represents (e.g. the total revenue, profit or costs).
ABC analysis is based on the Pareto Principle which uses the 80/20 rule. When applied to the business sector, this may mean that 20% of customers generate 80% of the revenue. However, it can also mean that 20% of goods take up 80% of the storage space. The ABC method helps to determine which goods, services and customers are more profitable and resource efficient and which are uneconomical and cost intensive.
You can then use the information gleaned from analyzing the factors’ costs and benefits to provide a foundation on which to base business decisions concerning areas such as customer service, sales and marketing. For example, this can help to identify which customers should be offered special deals given their importance, which goods should only be purchased when needed due to their high storage costs, which products might benefit from a targeted marketing campaign and which tasks should be prioritized if the company gets into a tight spot again.
The results from ABC analysis can help you prioritize your tasks by highlighting which customers or projects are important to the company. However, the Eisenhower method is much better suited to increasing productivity in day-to-day business operations by prioritizing work tasks.
ABC analysis is therefore an important tool for assessing the current situation in a company and helps those in charge adopt appropriate measures to increase revenue.
An example of how to conduct an ABC analysis
The following example clearly illustrates how to implement ABC analysis in a real-life situation.
The problem
Our inital question is: “How can you minimize the procurement costs for the manufacturing of a specific product?” One possible solution would be to purchase cost-intensive resources more sparingly and to process them more efficiently.
Data collection and analysis
The first step is to use the ABC method to determine which stock materials incur the highest costs.
| Resource | Quantity | Unit price | Usage value | Share of value (%) | Group |
|---|---|---|---|---|---|
| 1 | 450 | 320.00 | 144,000 | 21.28 | A |
| 2 | 3,400 | 16.00 | 54,400 | 8.80 | B |
| 3 | 700 | 480.00 | 336,000 | 49.66 | A |
| 4 | 12,000 | 0.45 | 5,400 | 0.80 | C |
| 5 | 6,500 | 3.50 | 22,750 | 3.36 | C |
| 6 | 120 | 950.00 | 114,000 | 16.85 | B |
| Total | 676,550 |
In this example, you can clearly see that resource 1 and 3 account for the largest share of the procurement costs at around 71%, while 2 and 6 are somewhere in the middle at around 25% and 4 and 5 incur the lowest procurement costs at only 4% despite their high quantities.
Defining the groups
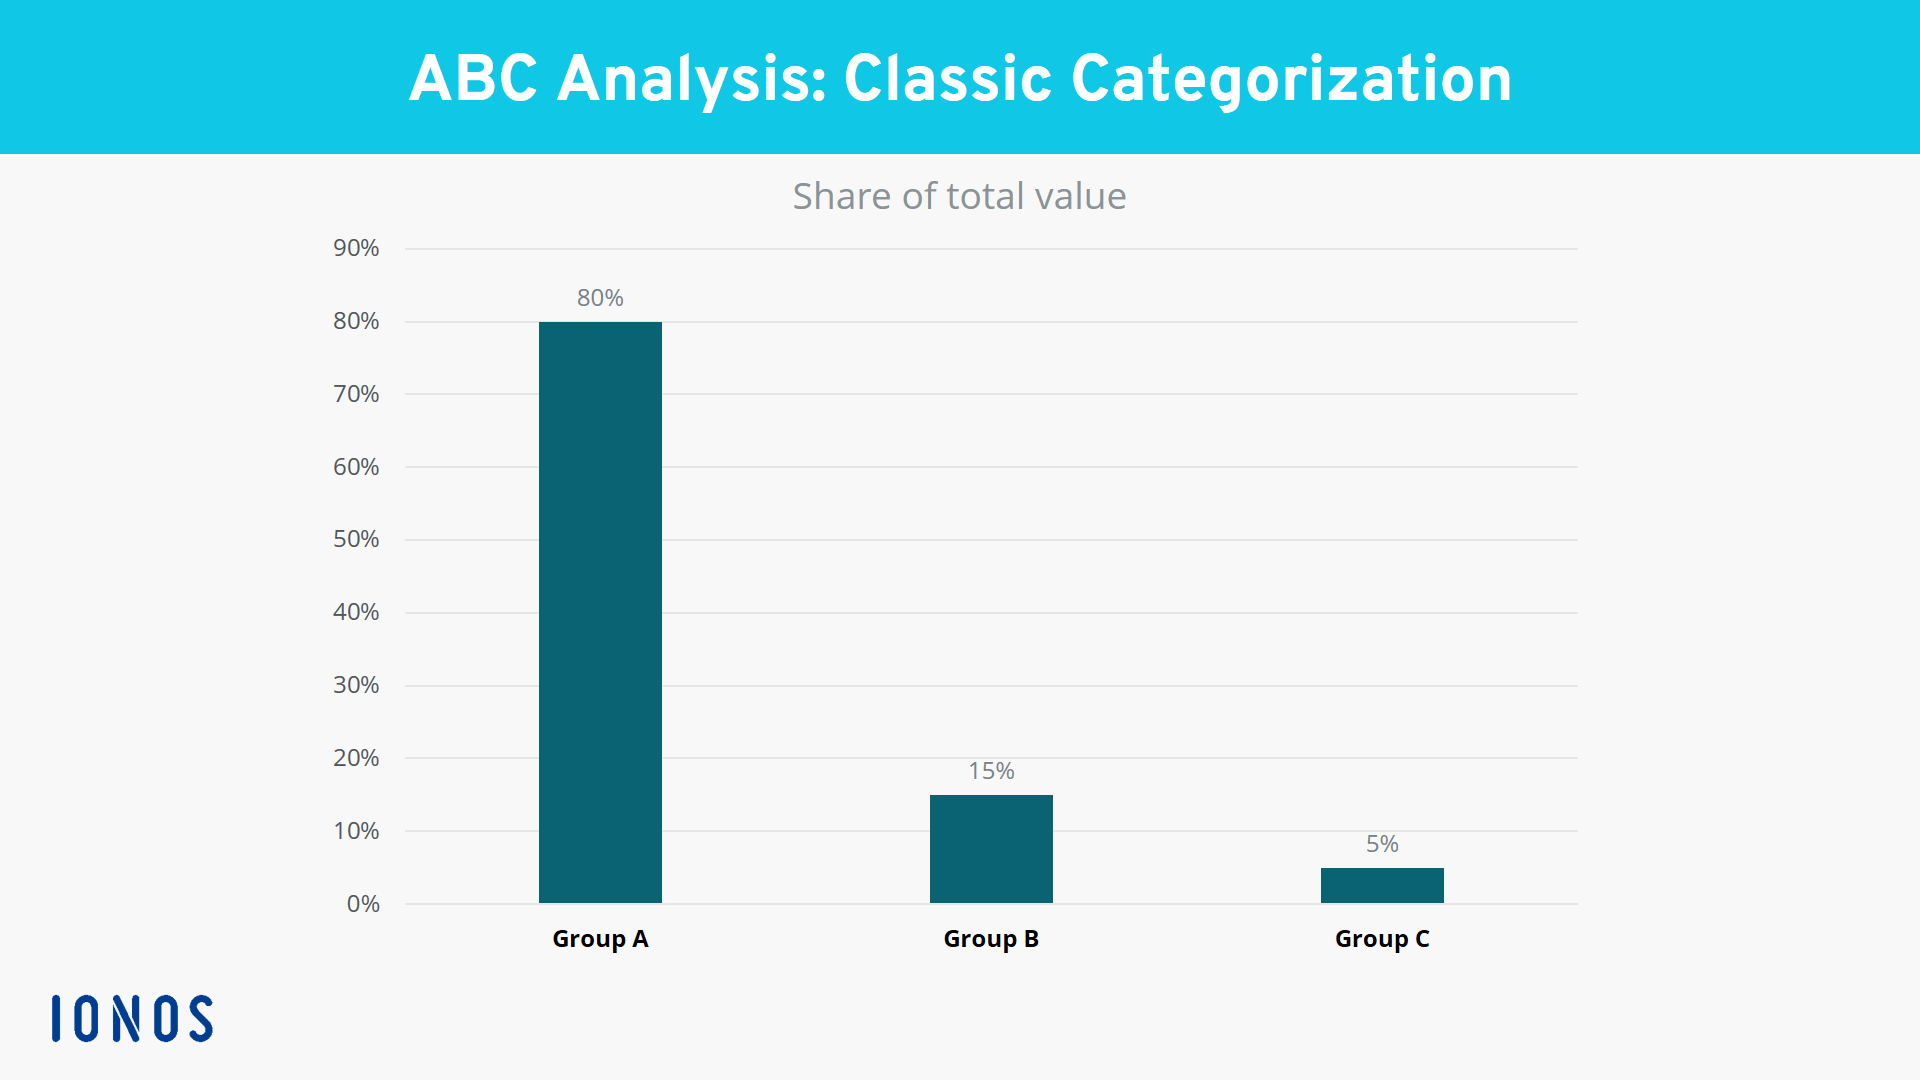
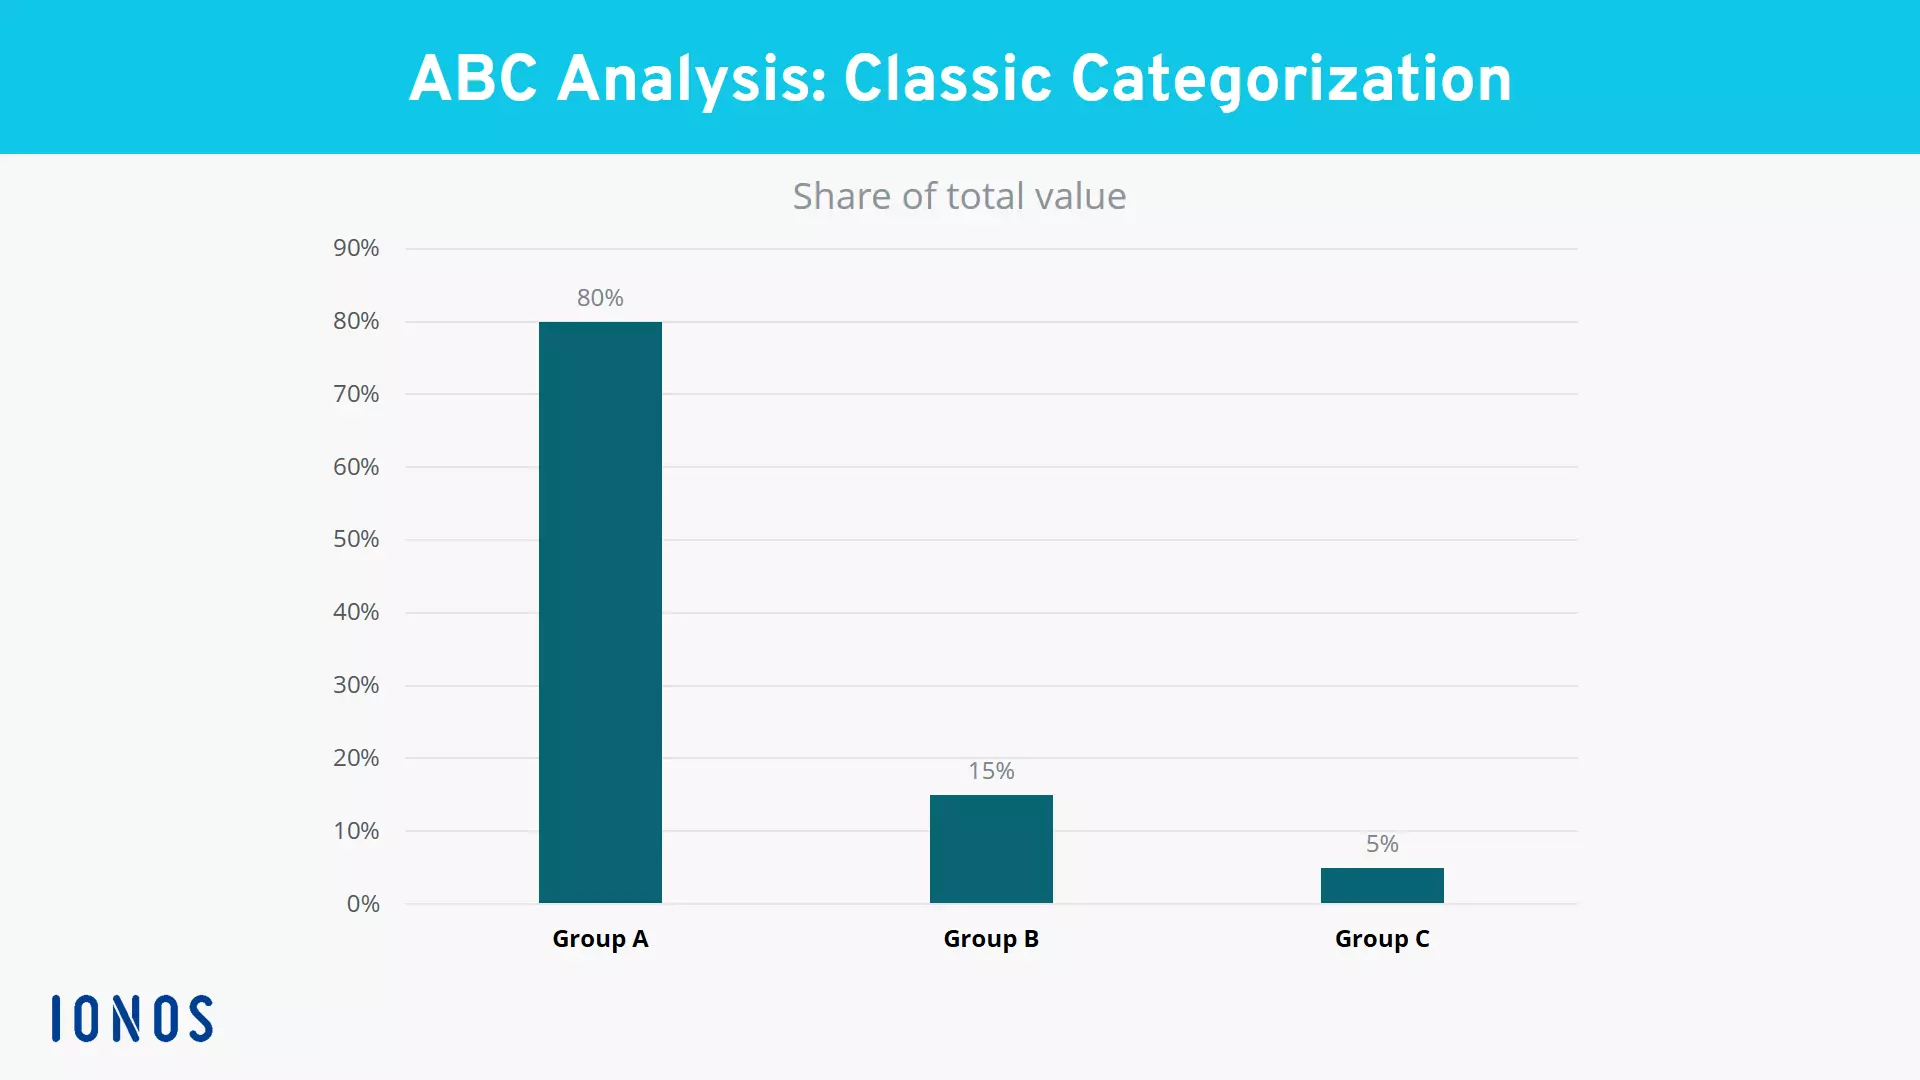
This distribution resembles the classic situation you would find in a textbook in which the individual groups are separated into category A with 80%, category B with 15% and category C with 5%. However, these values are only intended to be used as a rough guide. Each company can define their own limits for the individual groups based on their needs and even introduce additional categories (D, E, etc.). All that matters is that the individual items’ percentage shares of the total value differ significantly so that you can define a clear limit. Otherwise, an ABC analysis will not be able to produce any meaningful results.
Analysis through the ABC method
Once you have the data and have assigned the resources into category A, B or C, you can then deduce how to save money in the future. Since resources in category A account for the largest share of procurement costs, they should be purchased sparingly and only in small quantities. Depending on the specific resource in category A and how easy or difficult it is to procure it, it may even make sense to only purchase it as needed.
Meanwhile, resources in category C are needed in large quantities and are cheap to procure. They only account for around 4% of procurement costs. Therefore, they can be purchased and stored for the long term as long as there is sufficient storage space available and storing them over the long term does not incur any additional costs. You can determine whether this is the case through an additional ABC analysis which focuses only on storage costs.
The advantages and disadvantages of ABC analysis
As demonstrated in the example above, ABC analysis is great for breaking complex processes down to their essentials and presenting them in an easy-to-understand way. All companies have the key figures required for this analysis since they are needed for controlling and accounting anyway. This means that the preparation time needed is manageable and that the analysis can be easily conducted at any time. Another one of this method’s strengths is that it can be applied to a wide variety of business areas and can thus provide valuable information for future strategic business decisions.
Nevertheless, this method does have its disadvantages. For example, in some cases the use of three categories is too general. In addition, it does not make sense to use this method if the different items’ percentage shares of the total value barely differ from one another, since this makes categorization very difficult or even impossible. In this kind of situation, other analysis methods would be much more useful. Another disadvantage is that ABC analysis usually only compares a single factor within the categories. It also only takes quantitative factors into account. The ABC method does not examine how qualitative changes can affect revenue.
With just a little effort, however, you can modify ABC analysis to adapt it to the specific conditions within your company. For example, you could add additional categories or combine several factors together beforehand to create a new key figure to compare if needed.
Reviewer

Anne-Laure Wolber
Anne-Laure has been part of the IONOS Digital Guide since its inception in 2016. As an expert in the startup category, she focuses primarily on the strategic integration of SEO, GEO, and conversion rate optimization. Over the years, she has also gained extensive experience in related performance disciplines such as lead generation and native advertising. As a polyglot, she leverages her multilingual background to develop content strategies with precision and impact for international audiences.