

Break-even point – simply explained

Break-even point – simply explained
Every business professional would like to eventually generate profit. But this is only achieved when revenue is higher than costs. And sufficiently high turnover is in most cases not generated right after the company is founded. During the first few years, costs are often higher than turnover. This means that the company is initially situated in the loss zone. Should turnover increase over time, the company will move closer to the profit zone. If costs and turnover are at the same level, the company has reached the break-even point threshold.
The BeP threshold separates the loss zone from the profit zone. At the break-even point, the company makes neither a profit nor a loss.
If you want to determine the BeP for a single product, it will be specified as a quantity of items (single-product analysis). The BeP for several products or for an entire company will be specified, in contrast, as the amount of turnover that must be earned in total (multi-product analysis).
Colloquially, BeP also refers to the time at which a company breaks even.
Break-even point
For calculating the BeP, you must be familiar with two factors: the company’s turnover and costs. The BeP is reached when turnover and costs balance each other out.
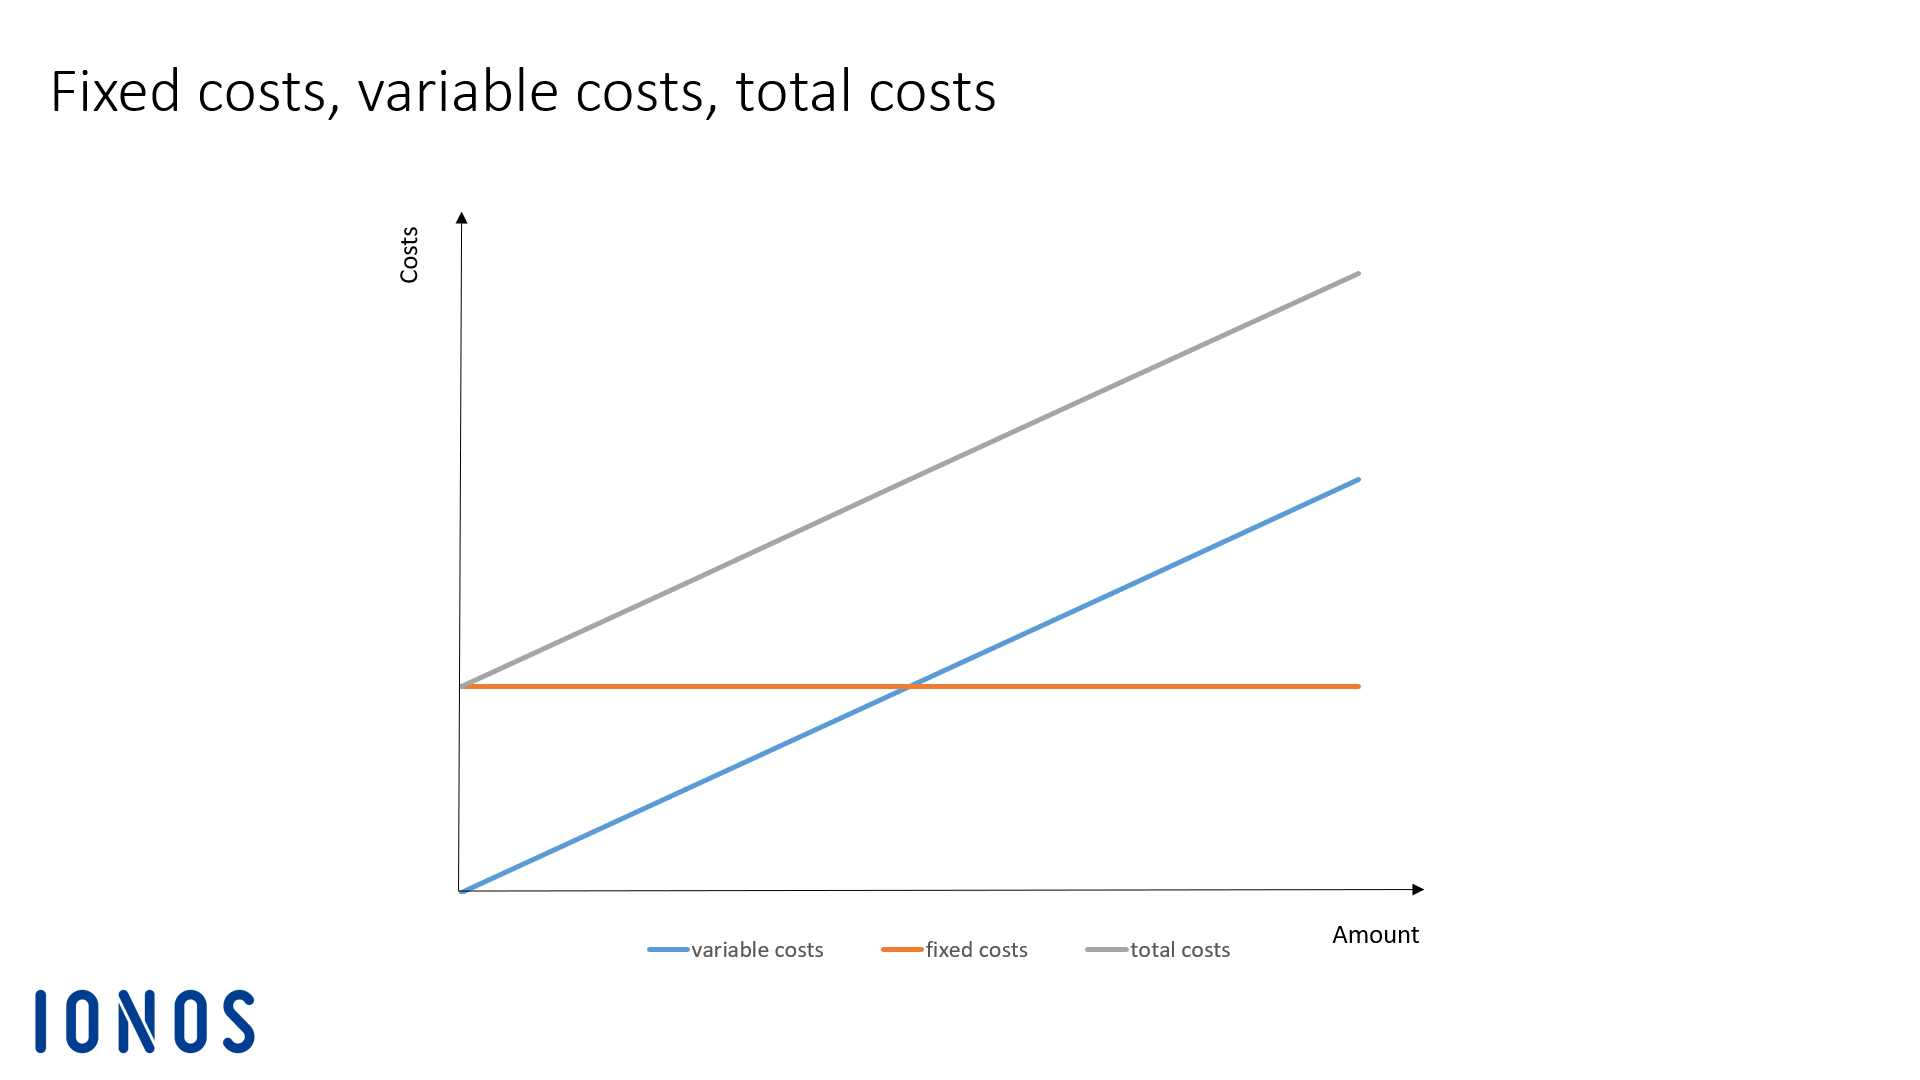
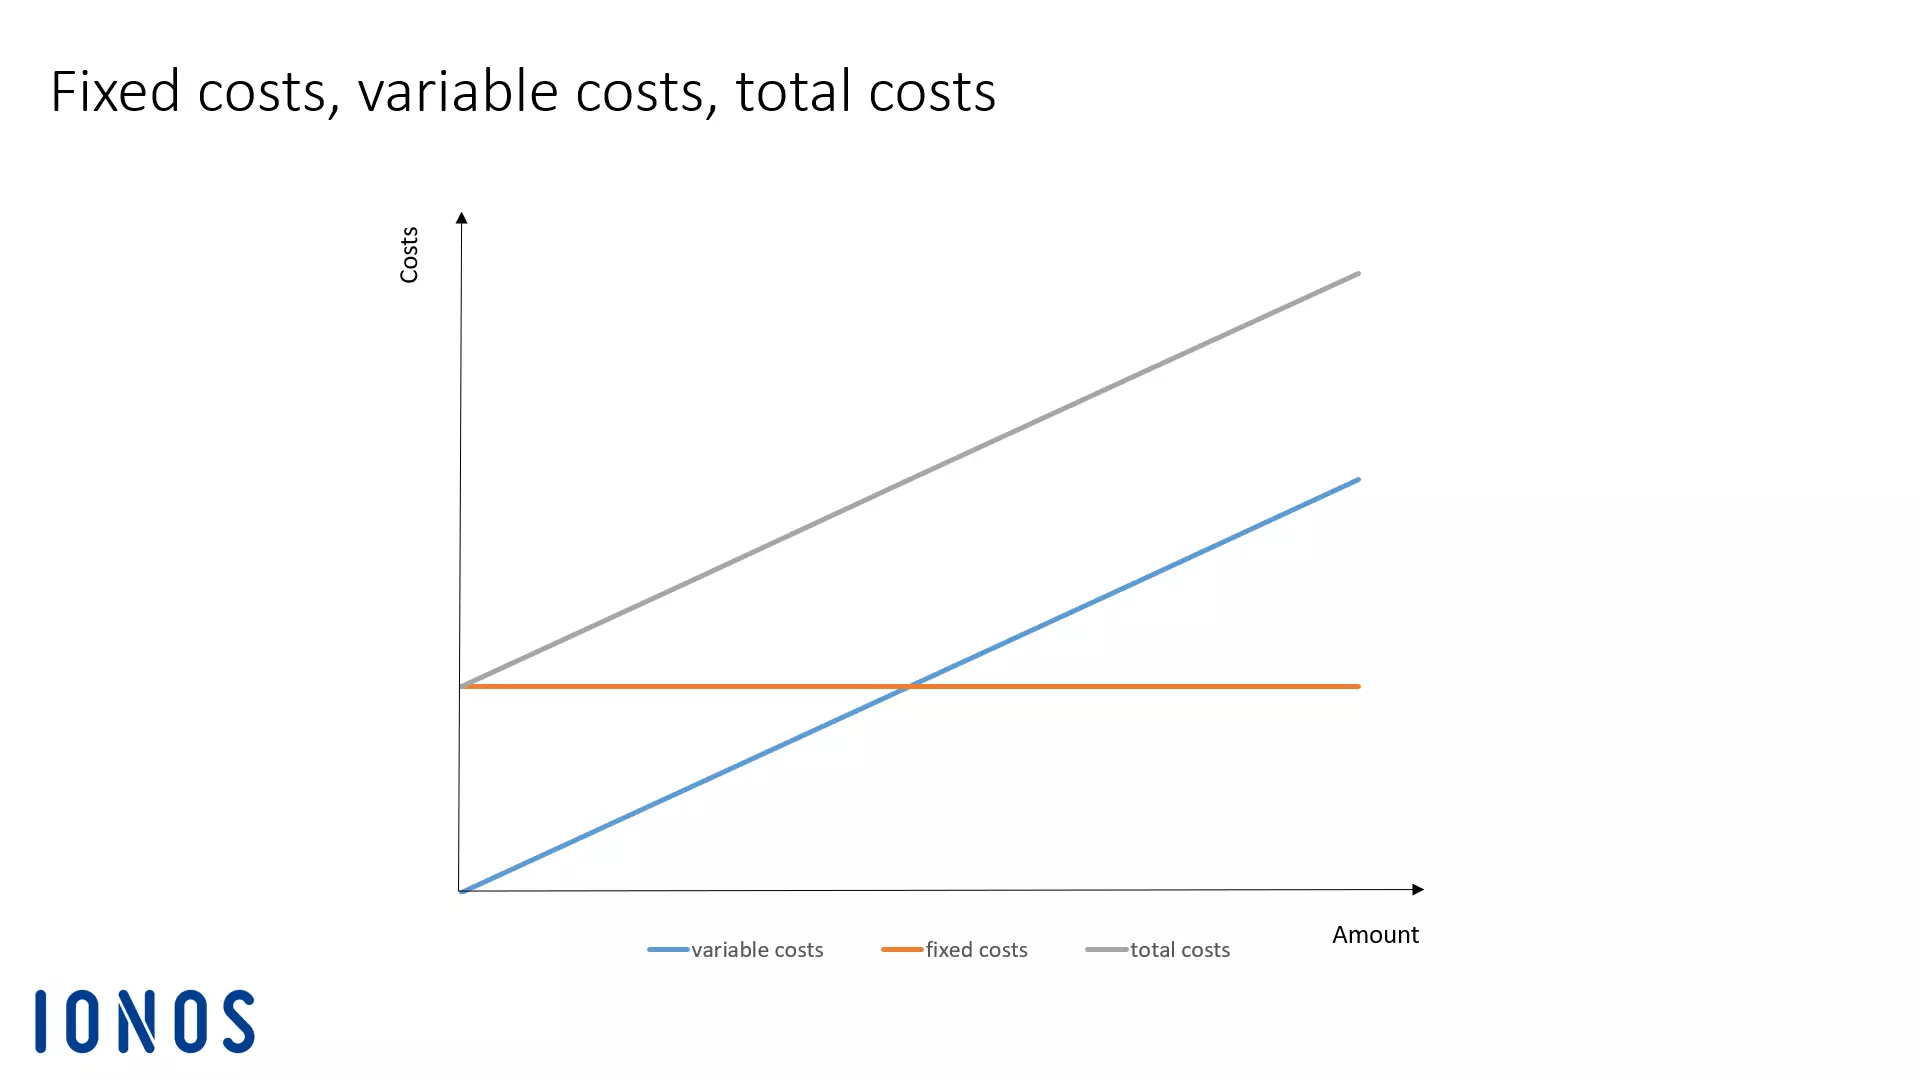
With respect to costs, it’s necessary to make a distinction: In every company, fixed costs and variable costs are incurred. The sum of both is the total cost.
The BeP can be represented in this simplified formula:


The break-even point refers to the point where the total costs (fixed costs + variable costs) related to production or a product are just as high as the total turnover.
Break-even point: the basics
In order to calculate the BeP or break-even point, you must first be familiar with a few cost accounting terms: fixed costs, variable costs, and contribution margin.
- Get started with stunning designs
- Grow with advanced marketing and admin tools
- Sell on social and online marketplaces
Fixed costs
These are always incurred regardless of how much is produced or sold. These costs are independent of time. They accrue during company holidays as well. Fixed costs include:
- Rent
- Salary costs for permanent employees
- Insurance premiums
- Lease payments
- Interest
- Depreciation
Variable costs
The amount of variable costs is dependent on the volume that is produced and/or sold. As a result, variable costs fluctuate and are performance related. Variable costs include:
- Material consumption
- Energy costs
- Freight and transport costs
- Costs for temporary workers
- Piecework wages
If the variable costs increase at the same rate as the production or sales volume, they are referred to as proportional variable costs. Should the variable costs increase at a faster rate, then they are referred to as progressive variable costs. They progressively increase, for example, if the maintenance costs for machines sharply increase due to increased production. Variable costs can also be degressive, meaning that they increase less sharply than the turnover. That can be the case, for example, when you receive volume discounts due to larger purchase volumes.
If you divide a product’s total variable costs by the produced or sold item volume, the result is the variable costs per unit. A product’s sale price should at least be as high as the variable costs per unit, otherwise the company cannot stay in the market for long. This is why the variable costs per unit is also called the absolute minimum price.
The sum of the fixed and variable costs is the total cost.
Contribution margin
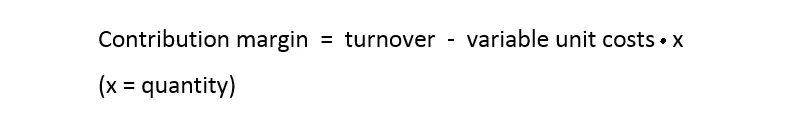
The contribution margin is what remains after subtracting the variable costs per unit from the selling price per unit.
The contribution margin is easy to calculate, provided that you have an overview of your company’s cost structure.

The contribution margin is available to the company so that it can cover its fixed costs. This means that the higher the contribution margin, the more fixed costs will be covered by the generated revenue. The contribution margin is thus a deciding factor for determining the break-even point. If it is higher than the fixed costs, then the company makes a profit. If the contribution margin is at $0, then it breaks even.
The break-even point formula
How much of a product must I offset in order to reach the BeP? Every company that wants to break even should ask this question. The calculation looks like the following:
First of all:


In order to determine the unit amount x at the BeP, these two equations must be set equal to one another and solved for x:

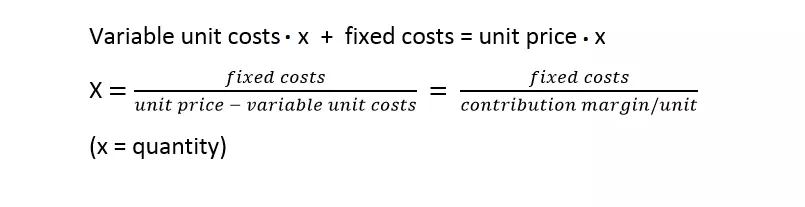
With this single-product analysis, you determine an individual product’s unit volume. This is necessary for covering this product’s total costs.
Most companies don’t produce and sell just one product, but rather several different products. This makes the calculation a bit more complicated as the BeP cannot be represented in individual unit amounts. Ultimately, the products’ prices and variable costs reach various levels, and the BeP for each product has a different unit volume. In cases like these, the BeP is therefore specified as the minimum turnover that the company must achieve with all its products. With this multi-product analysis, the factor by which each product contributes to the coverage of fixed costs must first be calculated. From the factors of all products, a standard factor will be determined by which fixed costs will be divided. The result is the total turnover that must be generated in order to break even.
Calculating the BeP answers two important questions:
1. How many products does the company have to produce and sell in order to cover its fixed costs? (single-product analysis)
2. How much turnover does the company have to generate in order to cover its fixed costs? (multi-product analysis)
Example: A hotdog stand’s break-even point
Keith and Alexandra have been managing a mobile hotdog stand since July. They sell hotdogs at different sites throughout the city and each month incur fixed costs of up to $800 (e.g. site rental, leasing fee for the truck, insurance, electricity, etc.). Hotdogs cost $0.70 a piece, and also incur a per-hotdog cost of $0.10 for bread, ketchup, and a napkin. They sell the hotdogs for $2.80 each.
Step 1: Determining the per-hotdog contribution margin


Step 2: Calculating the break-even point

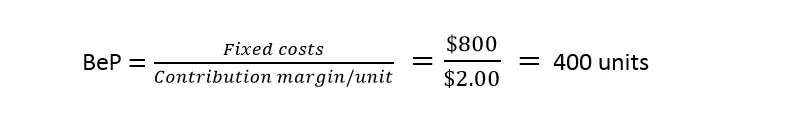
Keith and Alexandra must sell 400 hotdogs each month in order to avoid any losses. Once they sell 401 hotdogs, they will have made a profit of $2.00.
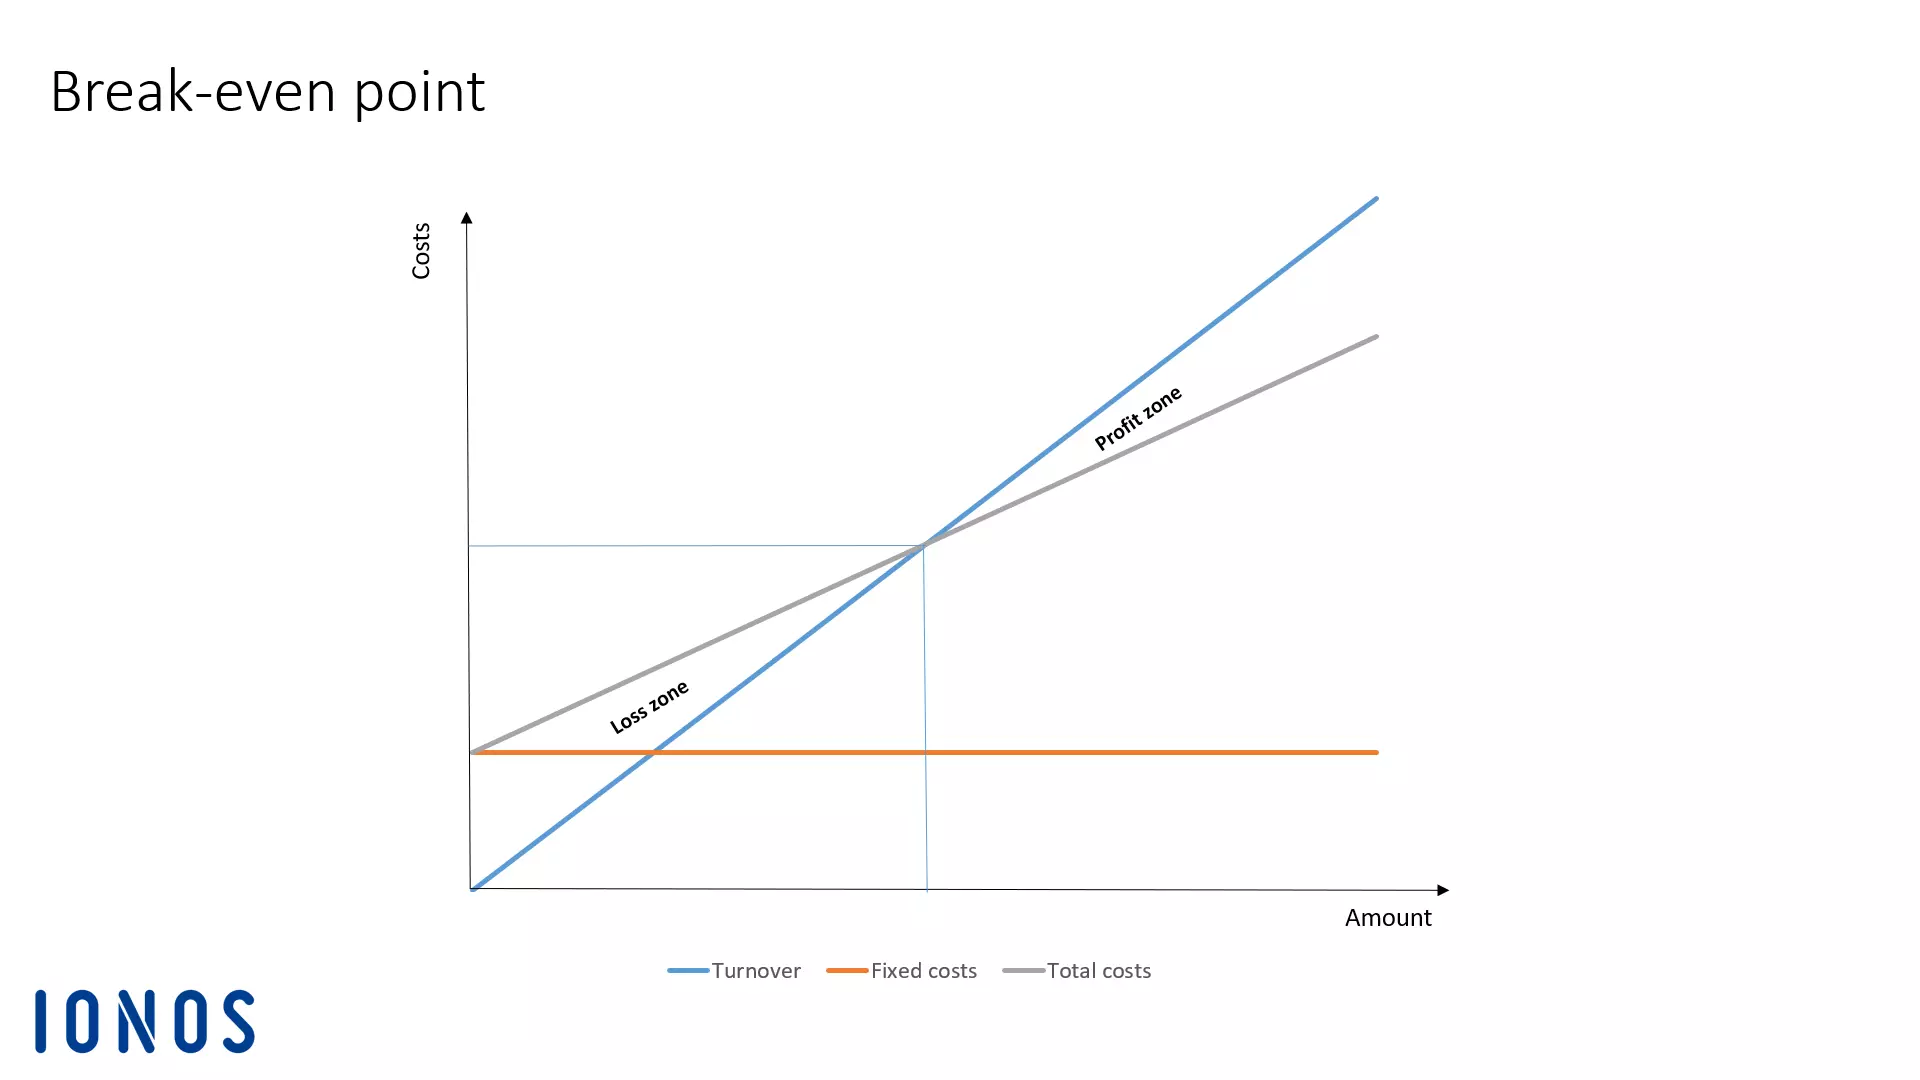
Break-even point: graphic representation
The BeP is located where the revenue curve and total costs curve intersect on the diagram. At this point, the total costs are just as high as the total revenue, meaning that the company is making neither a profit nor a loss. Should more products be sold, the company will enter the profit zone. Should sales decrease, it will slide into the loss zone.

The break-even point analysis: an important planning tool for your company
The BeP is especially an important indicator for emerging companies. It is a warning sign if the minimum revenue or unit sales volume required for the BeP isn’t achieved. If this happens, the company must act immediately in order to guarantee its survival. The following are possible practical solutions:
- Intensify sales efforts
- Reduce fixed costs
- Reduce variable costs
- Discontinue production or parts thereof
Should you observe the development of the BeP over the course of a long period, you can identify if the company is moving closer to it. Using the BeP, you can also predict how much of a decline in revenue the company can take without going into the red.
If you plan to incorporate a product into its product range, a BeP analysis helps you establish if the expected sales volume is over or under the BeP. In doing so, you must of course always take into account the fact that the company’s cost structure can change with the expansion of its product range. Fixed costs may increase as salaries for new specialists are paid for, or the area being used until now may become inadequate requiring more space to be rented. On the other hand, purchasing conditions for raw materials or parts could improve due to the larger volumes.
Storage costs are not considered in the BeP analysis. They must be added separately.
The BeP analysis should not be the company’s only tool for analysis. This is because calculating a BeP is based on certain premises:
- The distribution of costs into fixed and variable costs is correct.
- The production value corresponds to the sales volume.
- The prices and production program remains consistent during the period under analysis.
If these premises are not met, the BeP’s significance will be limited.
Click here for important legal disclaimers.