House of quality
When you develop a product, you have to consider a wide range of aspects, accept compromises and make critical decisions at every turn. This is the only way to create a high-quality product. You need to focus on customer satisfaction, but you can’t ignore technical requirements and cost-effectiveness. You have to balance these factors if you want to develop a successful product. Here’s where the house of quality comes in. This matrix lets you analyze customer- and product-specific aspects in fine detail. We’ll explain how it works.
House of quality – the process explained
The house of quality process is a component of quality function deployment (QFD). The QFD method helps you assure quality when you develop products and deliver services. QFD uses various matrices for this purpose. The first and often most important matrix in QFD is called the house of quality because it’s shaped like a house with a roof and body. In this matrix, you start by separating customer needs from technical requirements and evaluating the two factors independently of each other. You then correlate two types of requirements and start planning for implementation.
The QFD house of quality combines different aspects of product development in which different departments collectively develop the matrix. Ideally, the marketing, research, and production departments collaborate on the house of quality.
The house of quality is normally built in 10 steps (sometimes 11). You start by recording the customer’s desires, evaluating competing products, and then focus on technical attributes. Ratings play a major role here: You use points to rate the technical requirements and importance levels on different scales.
A house of quality example in practice
You fill in the house of quality matrix in a predetermined order. As you do this, a picture emerges of how you need to plan the product (or service). Since all departments collaborate on the matrix, conflicts are avoided when the time comes to implement the plan.
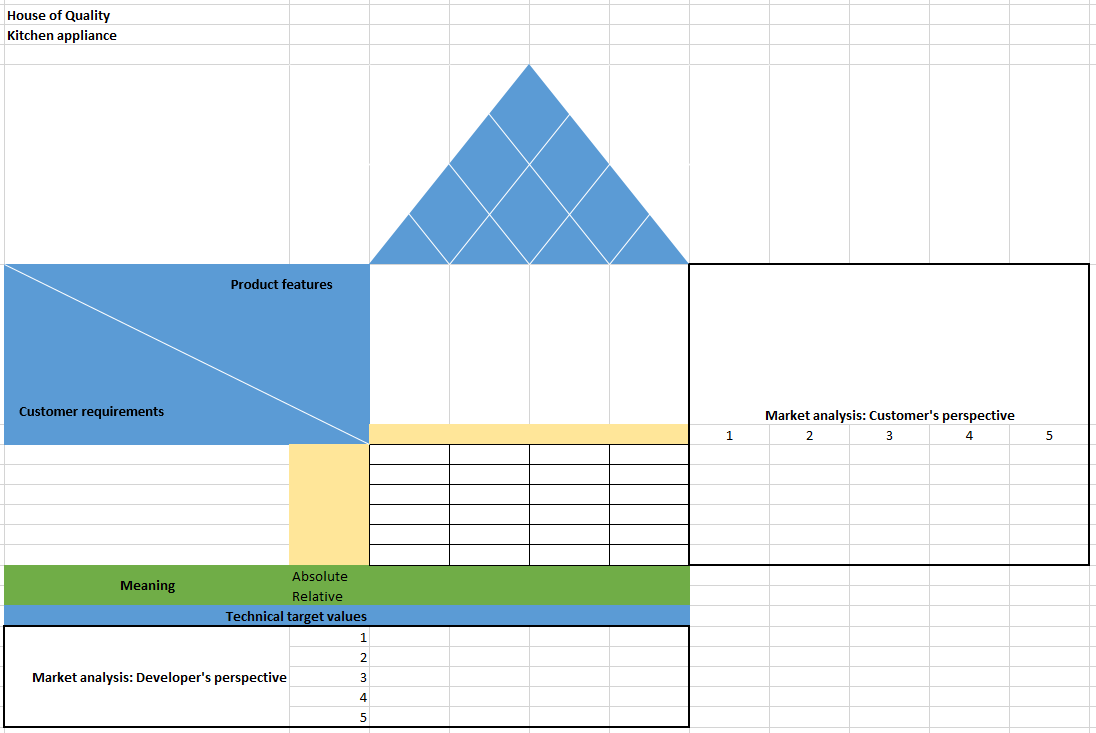
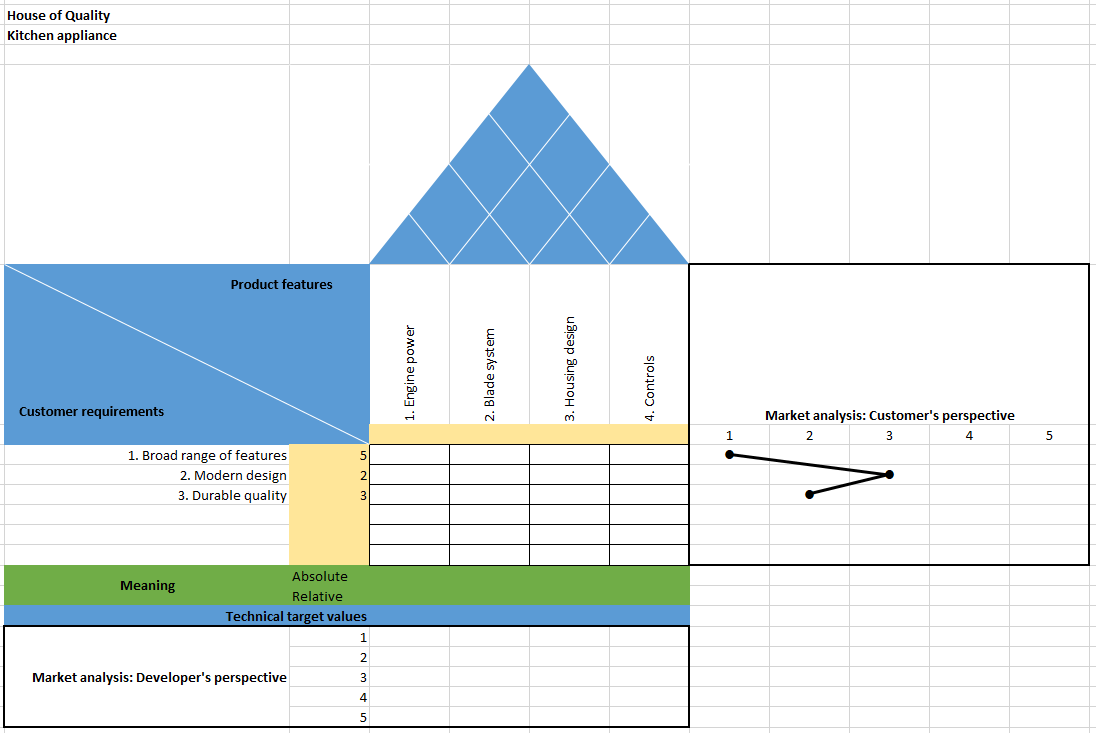
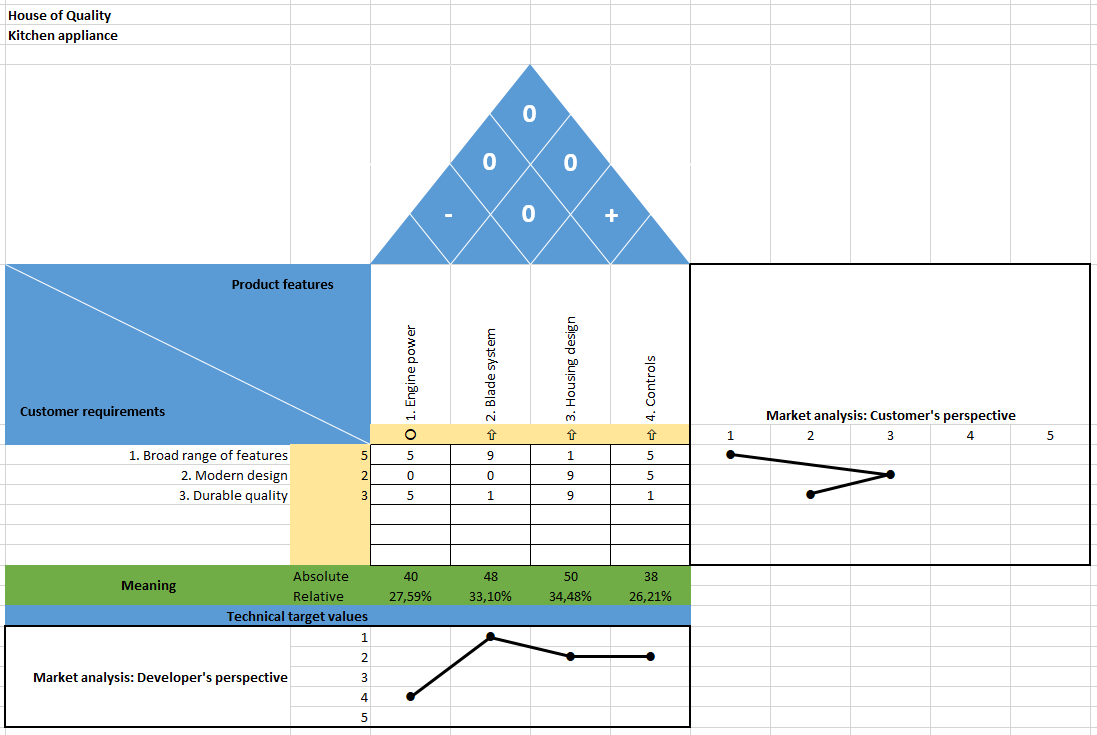
Our example illustrates the development process for a food processor and starts with an empty house of quality.
Step 1: Capture customer requirements
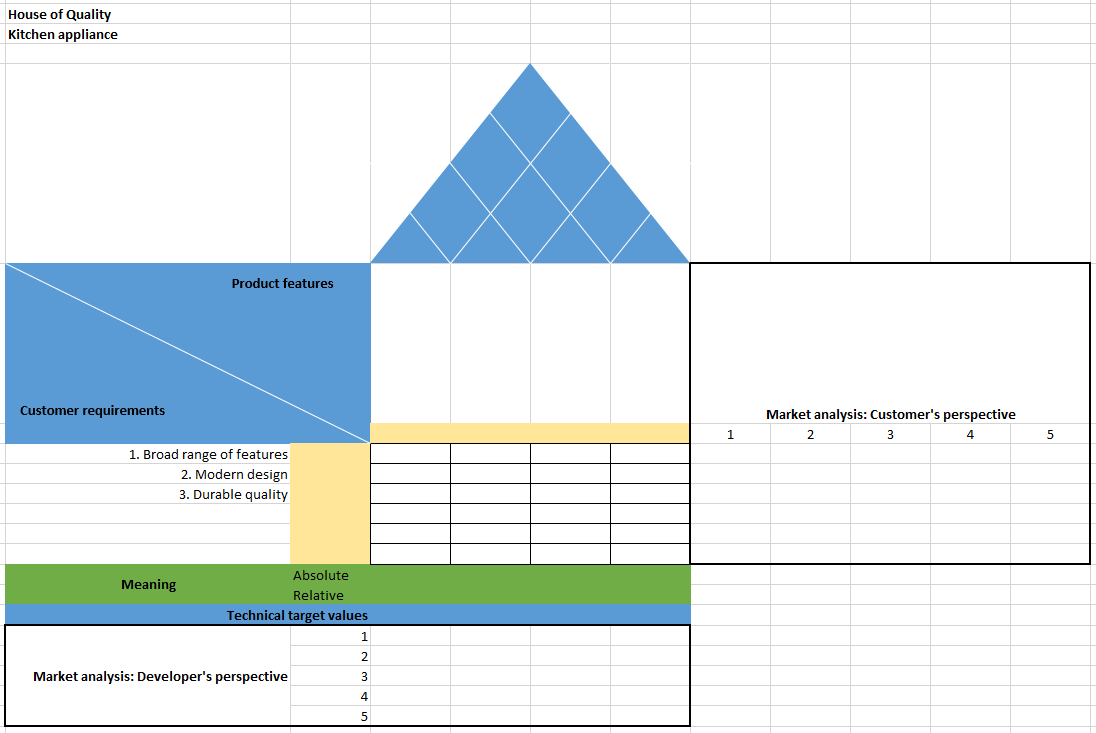
You start by focusing on the left side of the house of quality. This step involves the marketing team. You list all customer requirements that are relevant to the product. Conducting a survey is one way of finding out what customers want. You can also use other methods such as market analyses to determine requirements because even potential customers often don’t have a clear picture of what they need from a product. The list of customer needs is often referred to as the “what” versus the “how” of technical requirements.
In our example, we want the food processor to have a wide range of features, a modern design, and long-lasting quality. We enter this information in the list. The order isn’t important.
Step 2: Weigh customer requirements
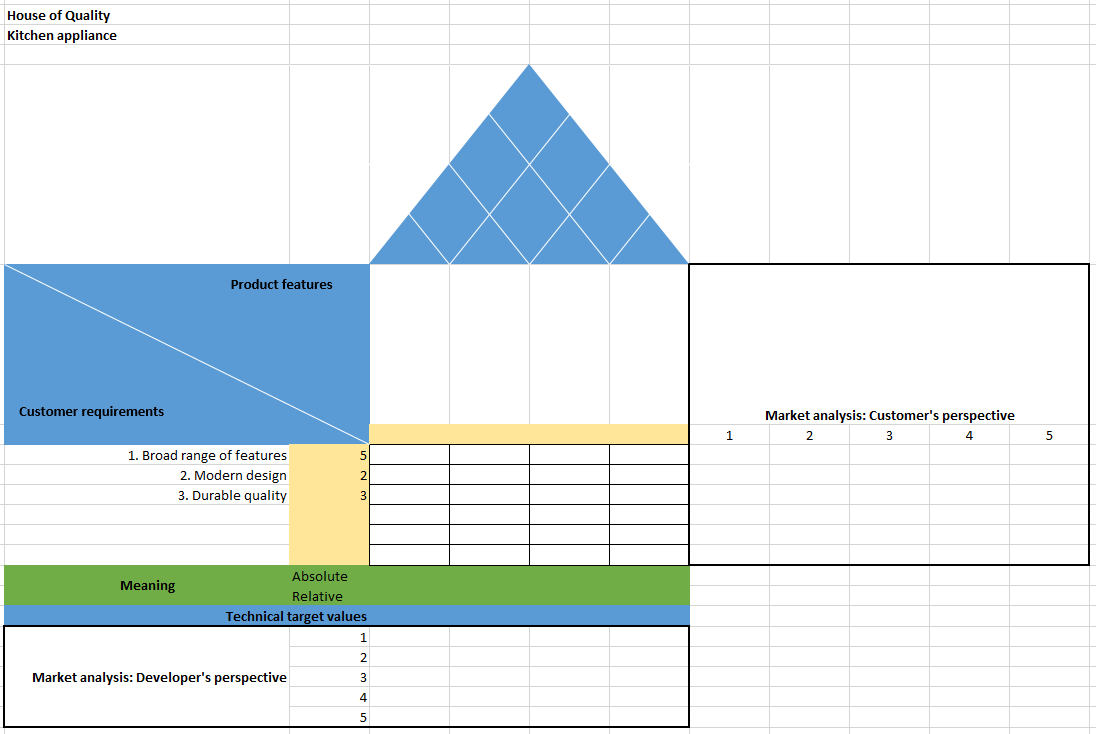
You assign ratings from 1 to 5 (the more important the aspect, the higher the number) right next to the list of customer requirements. You can also create your own scale if it makes more sense for the product and the team. You can solicit the information you need for classifying requirements by conducting customer surveys or communicating with customers. You can then figure out which requirements you should focus on in the planning process.
In our example, the range of functions is most important for customers. The other two requirements were ranked lower.
Step 3: Competitive analysis from the customer’s perspective
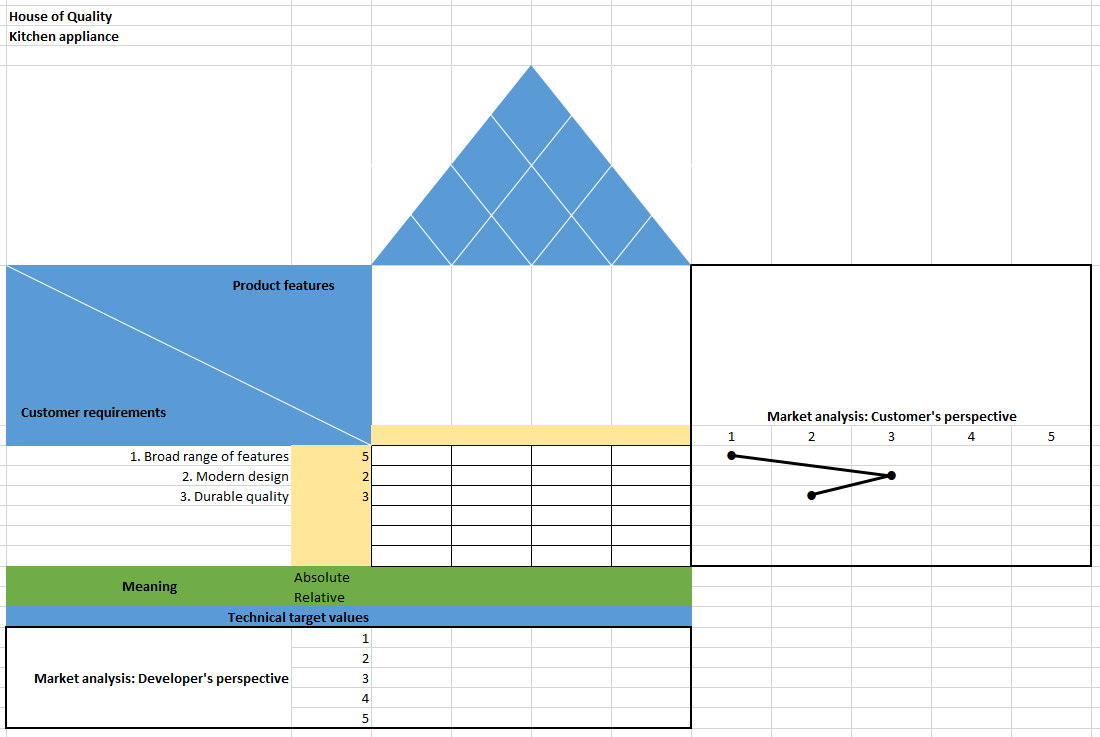
In the third step, you determine how your planned product compares to competing products. A carefully chosen, representative group of customers compares your product with leading products on the market (or with several competing products). Only one aspect of the customer requirements is compared at a time. In our example, the group of customers would assess how the functionality of the new product compares to the range of functions of competing products.
Once again, you can rate them on a scale of 1 to 5. A rating of 3 equals an equivalent product. Anything below 3 means that your product performs worse than the competing product in terms of the aspect being compared. A higher value means that your product is better received by potential customers. The table for this is located at the right edge of the house of quality. For better visualization, you can connect the individual points to create a graph. You can use different colors for better clarity when comparing your product to several competing products on the market.
Step 4: Define product attributes
While the first three steps primarily reflect the customer’s view and concern marketing, the fourth step requires input from engineers or product designers. Now the question is how exactly to implement the customer requirements. What steps are needed to create an appealing product? Examples include features such as motor power, blade systems, housing design, and controls. You assign this list to the top of the house.
Step 5: Determine direction of improvement
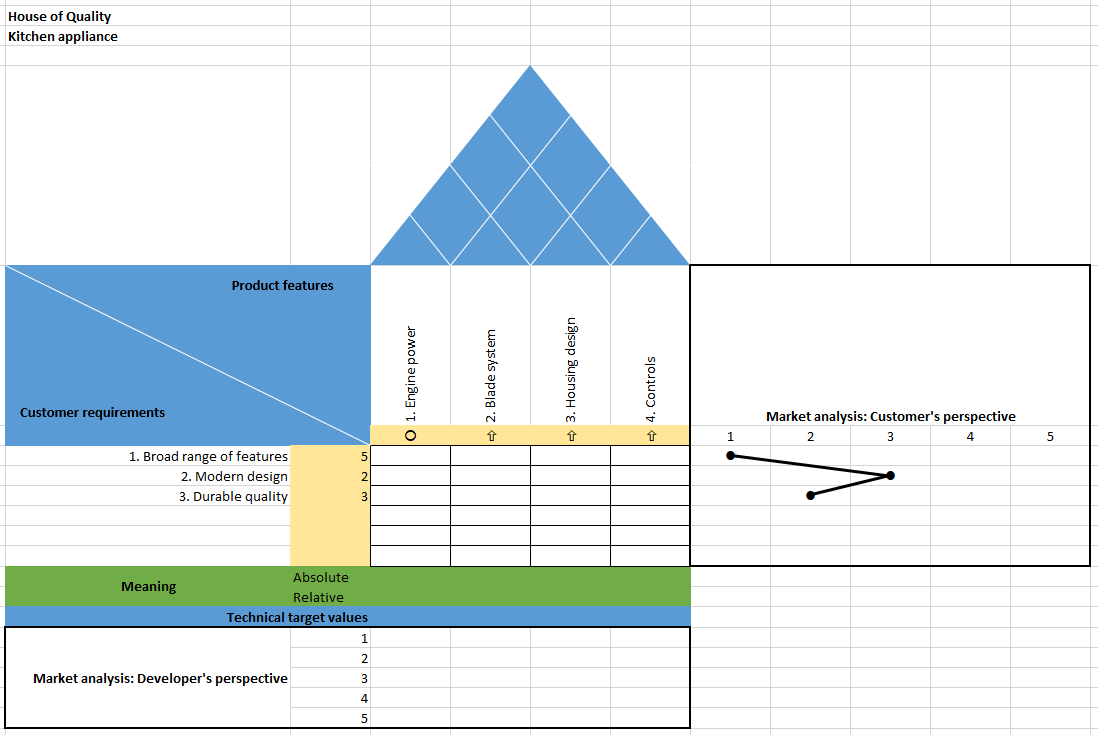
This step requires technical expertise. Now you determine the extent to which the actual state of the product attributes must be adapted to the target state that you derived from the customer requirements. You use three symbols to indicate this:
- Up arrow: The attribute has to be increased in order to optimize it
- Down arrow: The attribute has to be decreased in order to optimize it
- Circle: A target value is desired
In our example, we would expand the blade systems to achieve a wider range of functions. The motor power, on the other hand, already has the target value and is therefore marked with a circle. We would use a down arrow if the customer wanted the product to be cheaper, for example. In other words, the value of this attribute must be decreased.
Step 6: Determine relationships
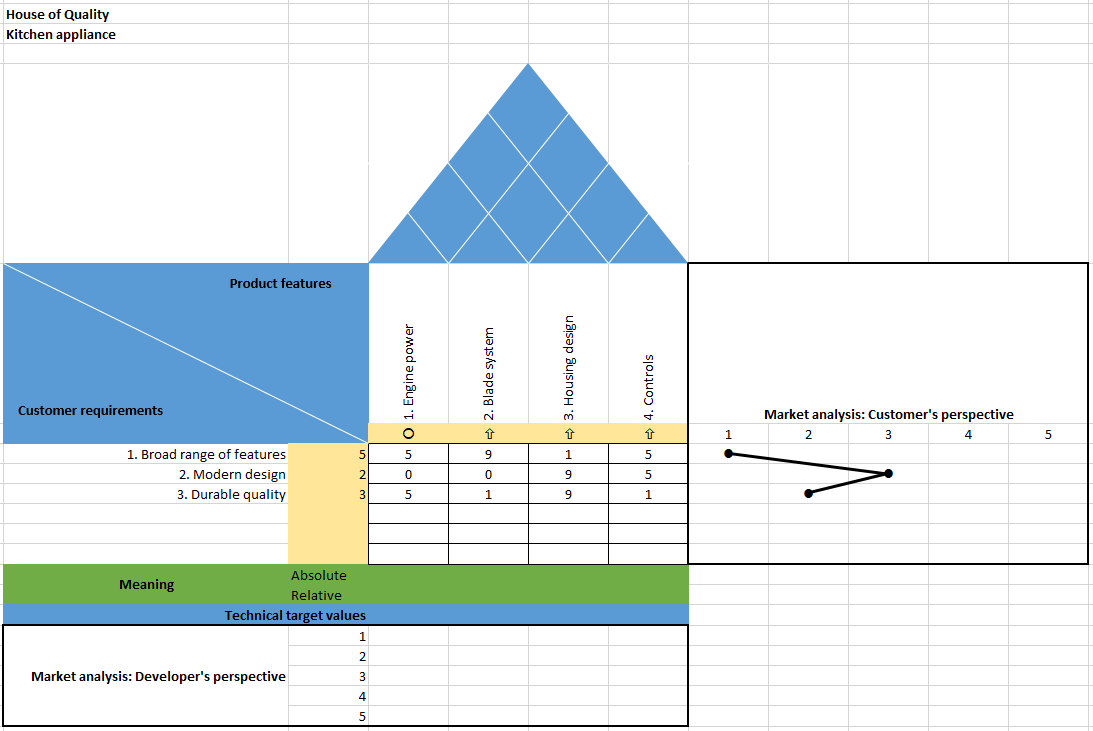
In the sixth step in building the house of quality, you fill in the actual matrix, which is like the body of the house. We now consider how the individual requirements relate to the product characteristics. You use four different values to evaluate the relationship:
- If there’s no connection at all, you specify a value of 0 or leave the field blank.
- A weak relationship is given a score of 1.
- A medium relationship is ranked 5.
- A strong relationship is rated 9.
This matrix uses a logarithmic scale instead of the linear scale used in other parts of the house of quality. This is important for the final evaluation.
In our example, we can see that the relationship between the blade system and the range of functions is very strong, and so is given a score of 9. Other relationships (such as the relationship between the range of functions and the housing design) are weak or non-existent.
Step 7: Analyze interrelationships
Now focus on the roof of the house of quality, meaning the triangular area above the actual matrix. This area shows the interrelationships between the individual product attributes. The question is: How does one function of the product relate to the other? You decide whether the relationship is positive, negative, or neutral, meaning whether the attributes or functions support each other, block each other, or do not influence each other at all. The type of relationships can be represented with the “+”, “-“, and “0” markers.
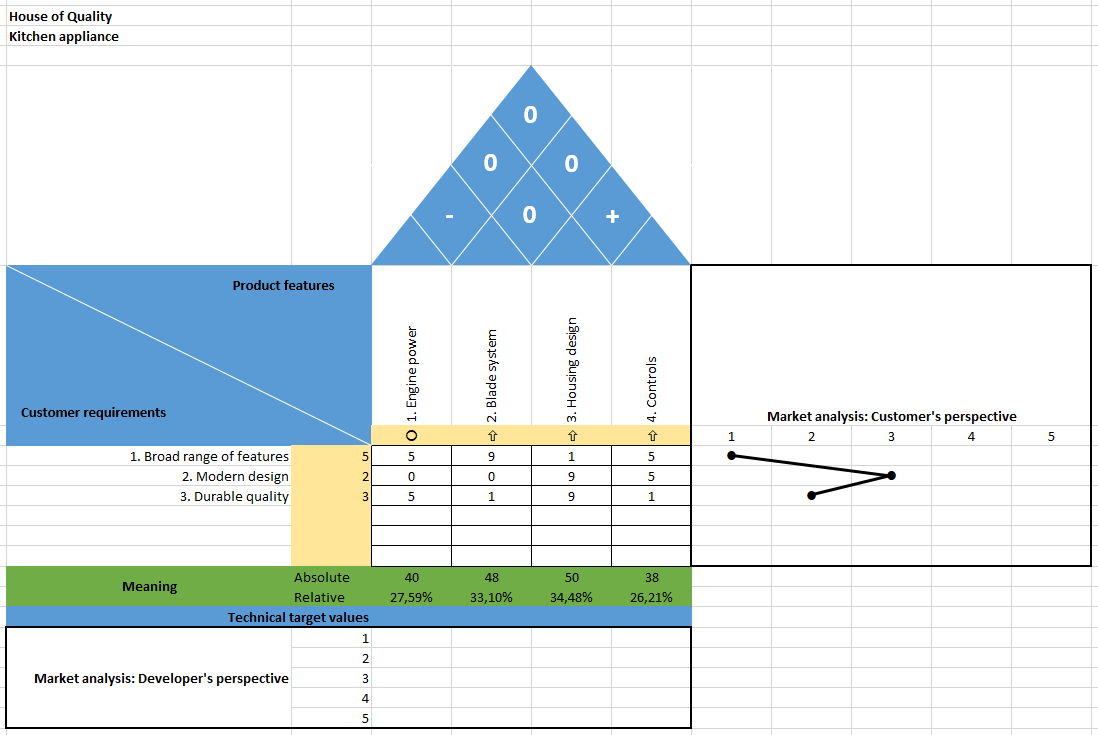
A correlation would be negative if the expansion of one feature were to affect the functioning of another feature. This is not the case in our example. Instead, the engineers in this example find that a bigger housing design increases durability and space for the controls.
Step 8: Determine importance
You can determine the importance of each product attribute by multiplying the values specified in step 6 with the weight specified in step 2 and then adding all the values. You now have an overview of the importance of each feature because you’ve already defined how closely each feature relates to customer requirements. This will help you with further product development. Enter the sum of each column in the bottom row of the matrix to build the foundation of your house of quality.
Experience shows that it’s helpful to specify a relative value in addition to the absolute value. In this case, you record a percentage, meaning you offset the possible maximum value against the actual result.
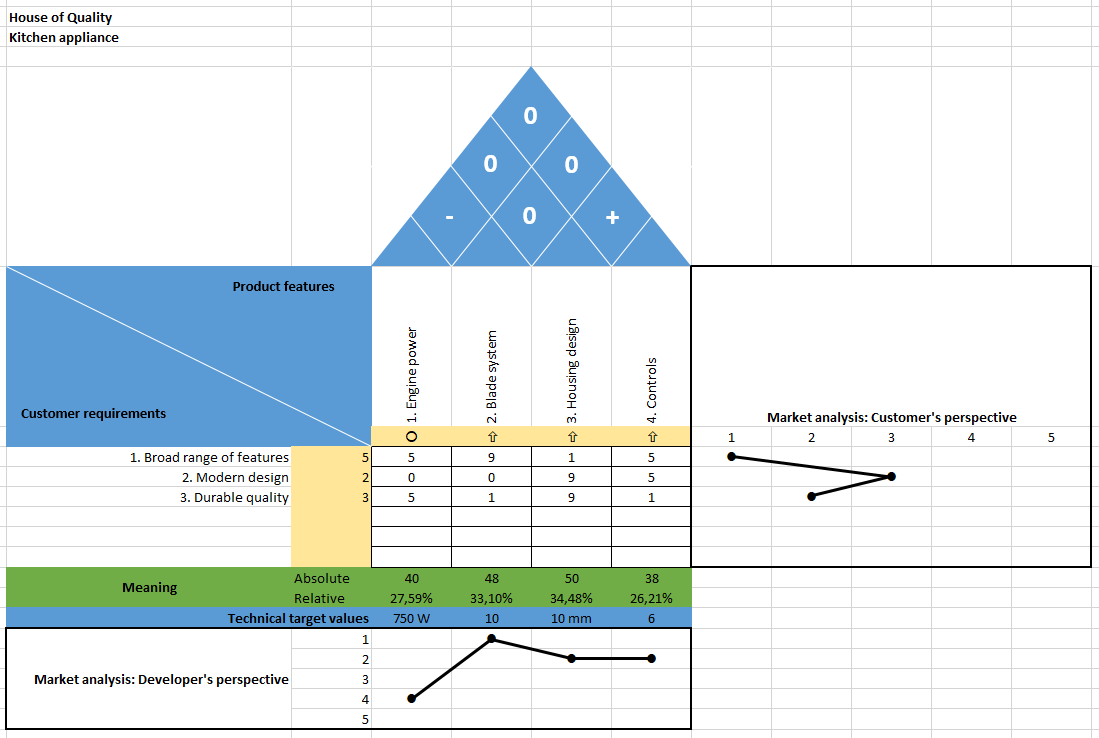
In our example, we would multiply the value 5 for the motor power by weight 5 (25). Next, multiply the value 5 by the weight 3 (15). Then add the two values to the absolute value (40). Since the maximum value in our example is 145, the resulting values in the graphic below show the relative importance of motor power, blade systems, housing design, and controls:
Step 9: Competitive analysis from the engineer’s perspective
You can fit another market analysis from the point of view of the product developers in the lower part of the house of quality (the basement). Just like in step 3, engineers compare their product (possibly still in planning) with the competing products on the market. However, the engineers now compare each individual product attribute and evaluate its performance compared to competing products. Just like the evaluation from the customer’s perspective, you assign ratings from 1 to 5 and connect the markings to form a graph.
Step 10: Define target values
Other possibilities
The house of quality can accommodate other information in addition to the steps presented here. Some teams add a difficulty level for each product attribute to their house of quality. Product developers then decide how difficult it is to customize the function or aspect of the product. This information also provides important input for subsequent planning. It often includes helpful comments and legends to ensure that everyone can understand the information later.
What are the benefits of the house of quality?
The house of quality offers several advantages. The first benefit comes from simply creating the diagram. Employees from different departments come together and collaborate on the house of quality. This inevitably leads to constructive discussions. The input from different departments ultimately ensures a high-quality, long-lasting, and successful product.
There are also advantages once the house of quality is fully completed. Thanks to visualization, a lot of important information for planning and development is available at a glance. Teams can repeatedly consult the diagram with its graphs and matrices throughout the product development.
The house of quality is an excellent starting point for product development planning. The “Kano Model” is another way to increase customer satisfaction in future projects. The perspective of the potential customer also plays a major role in this approach.

